
2016 Transit Service Performance Review: what are the top five routes in your area?
2016 Transit Service Performance Review: what are the top five routes in your area?
Last week, TransLink released the 2016 Transit Service Performance Review, a comprehensive look at ridership and service productivity for bus, SeaBus, SkyTrain and West Coast Express.
We know there’s tons of information in there to wade through so we’re back this week to share with you a couple more tidbits about boardings from the report!
What is a boarding? A boarding is considered each time a passenger enters a fare paid zone using Compass fare media or any other proof of payment.
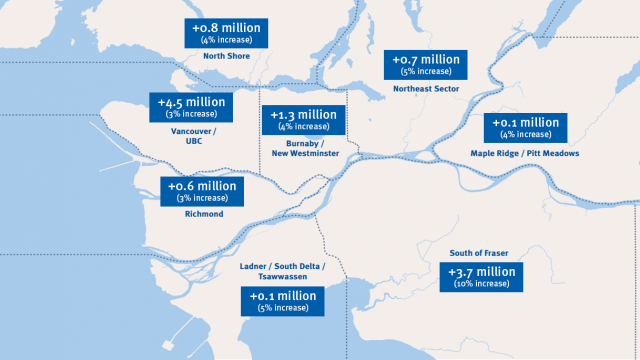
All sub-regions experienced an increase in bus boardings between 2015 and 2016, with the South of Fraser region experiencing the highest growth percentage. Check out the map:
Now, you may be asking now which are the top five bus routes in each of the subregions?
Top 5 routes by sub-region in annual boardings
Burnaby and New Westminster
- 135: 6,513,000 boardings
- 106: 5,948,000 boardings
- 130: 3,712,000 boardings
- 145: 2,628,000 boardings
- 123: 2,176,000 boardings
Ladner, South Delta and Tsawwassen
- 601: 1,152,000 boardings
- 620: 818,000 boardings
- 602: 121,000 boardings
- 603: 70,000 boardings
- 604: 70,000 boardings
Maple Ridge and Pitt Meadows
- 701: 2,085,000 boardings
- 791: 688,000 boardings
- C44: 76,000 boardings
- C45: 70,000 boardings
- C43: 56,000 boardings
North Shore
- 250: 3,323,000 boardings
- 239: 3,149,000 boardings
- 240: 2,903,000 boardings
- 246: 1,275,000 boardings
- 255: 1,222,000 boardings
Northeast Sector (Coquitlam, Port Coquitlam, Port Moody, Anmore and Belcarra)
- 097: 3,352,000 boardings
- 160: 1,497,000 boardings
- 169: 1,311,000 boardings
- 152: 1,017,000 boardings
- 143: 875,000 boardings
Richmond
- 410: 5,847,000 boardings
- 401: 2,926,000 boardings
- 403: 1,839,000 boardings
- 430: 1,462,000 boardings
- 407: 1,235,000 boardings
South of Fraser (Surrey, Delta, City and Township of Langley, and White Rock)
- 319: 4,711,000 boardings
- 096: 4,304,000 boardings
- 502: 2,721,000 boardings
- 321: 2,384,000 boardings
- 320: 2,207,000 boardings
Vancouver and UBC
- 099: 17,288,000 boardings
- 041: 9,019,000 boardings
- 020: 8,371,000 boardings
- 049: 7,506,000 boardings
- 025: 7,409,000 boardings
Top 10 crowded bus routes
Every transit agency grapples with overcrowding, and it happens in both peak and non-peak hours. What is overcrowding? In the Transit Service Performance Review, it is measured by looking at the number of annual revenue hours where the average peak passenger load, at the hourly level for each direction of service for each route, is above the crowding guidelines.
- 099: 35,000 hours
- 025: 12,000 hours
- 049: 10,000 hours
- 135: 9,000 hours
- 319: 7,000 hours
- 041: 7,000 hours
- 351: 5,000 hours
- 502: 4,000 hours
- 555: 4,000 hours
- 130: 4,000 hours
In 2016, overcrowding decreased slightly by 1 per cent—or 36,000 hours. On the 49, we cut overcrowding down to 14 per cent from 48 per cent in 2015. How did we do this? We introduced higher capacity buses all day and everyday!
And we’re just getting started. Phase One of the 10-Year Vision between 2017 and 2019 will mean more service improvements to reduce overcrowding throughout the region.
Top 10 routes by operating cost per boarded passenger
- 099: $0.60
- 125: $0.67
- 145: $0.77
- 049: $0.87
- 020: $0.93
- 106: $0.94
- 041: $0.94
- 590: $0.95
- 319: $0.95
- 112: $0.97
Note: This metric should not be equated to ‘cost recovery’ as it does not include fare revenue and does not consider transfers. The cost per boarded passenger measures the cost of providing revenue service compared to the total number of boardings that service generates.
Want to learn more? You can read the full 2016 Transit Network Performance Review.