APTA Rail 2010: It Takes a Region: Integrating rail investment in multimodal plans and programs
APTA Rail 2010: It Takes a Region: Integrating rail investment in multimodal plans and programs
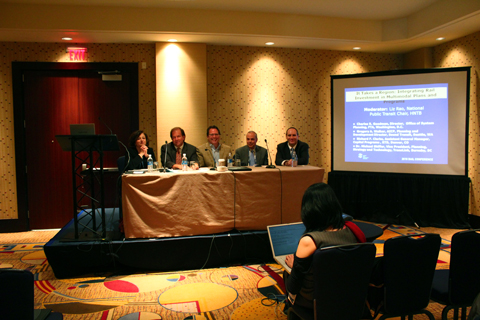
“It Takes a Region: Integrating rail investment in multimodal plans and programs” had four speakers that included our VP of Planning Mike Shiffer, so I dropped in on the session on Monday.
The speakers were:
– Charles R Goodman, director, office of system planning, FTA, Washington D.C.
– Gregory A. Walker, AICP, Planning and Development Director, Sound Transit, Seattle WA
– Richard F. Clarke, Assistant General Manager Capital Programs, RTD, Denver CO
– Dr Michael Shiffer, VP Planning, Strategy , and Technology, TransLink, Burnaby BC
They each brought a wide variety of perspectives to the table on this topic! Some were more like project updates than explorations of multimodal integration, but that was OK (and still interesting).
Here are my notes from the session. Things I thought were notable include:
a) the cost of rail projects anywhere is always in the billions of dollars,
b) sales tax sources can be quite unstable sources of revenue
c) Seattle has two floating bridges and one is slated for a light rail line
d) Denver’s project motto for their rail project is awesome: BUILD AS MUCH AS WE CAN, AS FAST AS WE CAN, UNTIL IT IS ALL DONE (it was indeed written in all caps)
Transit Oriented Development, Tools for Metropolitan Planning Offices (MPOs) – Charles R. Goodman
– Charles R Goodman, director, office of system planning, FTA, Washington D.C.
Note: Charles Goodman’s presentation dealt with America’s very different regional planning process around transit-oriented development. Quite frankly, I am not very familiar with the process so my notes are a bit scattered and may have misunderstood things. I hope this might be of use to you still.
Multimodal transport planning is a centerpiece of federal transportation planning since 1962
has gone on for half a century
but critical back then and today is that it sets a set of guidelines around which there is clearly quite a flexibility
so having regional multimodal planning processes
can mean a lot of things to satisfy fereal requirements
so for the specific examples are some of the opportunities being associated with transportation planining
you can satisfy the law and really not have a full faith involvement and the implications involved in the transportation system are significant
Key question: what is important tool?
Role of MPOs in TOD is not a new concept – report published in 1999 in preparation in the mid 90s entitled “building livable communities with transit”
– Having a model and then being able to run the analyses
important in an obvious aspect
– Basic data collection, trends on development patterns, in proximity to public transit stations
– public involvement is important: very key
Three S Process
– scale, scope and stakeholders
– network view of multiple TODs, allows for broader area jobs/hosuing balance
– acros topics (transportation, housing, employment)
– over “horizon” time (redevelopment may be generational)
– provides for outreach/education to facilitate public engagement
– wide range of stakeholders involved
Challenges to transit involvement:
– complex organization and work — seems overwhelming
– resistance by organizations (bullied out the transit operator)
– long range viewed less relevant than short term priorities
Strategies to overcome this challenges
– orientation for CEOs (APTA board members seminar)
– “Crash the party” – contact FTA region if denied access
– participate on board and committees (preferably GMs)
– engage in all aspects of plannign processes and products
benefits of being at the table
– transit is embedded in the mobility picture — not an add-on but a key aprt
key challenges raised by a cross section for MPOs
– resource limitations
– technical and professional capacity
– legal and institutional issues
Three categories of MPO Strategies Supporting TOD
– policy and programmatic
– technical
– logistics
Greg Walker — Sound Transit
Gregory A. Walker, AICP, Planning and Development Director, Sound Transit, Seattle WA
Puget Sound region
– not the first to be there – first inhabited 5,000 years ago
– many head offices in place: amazon.com, starbucks, boeing
– sound transit is planner, builder, operator of regional high capacity transit
– overview of Sound Transit properties
our biggest difficulty is talking to people about how much money we don’t have
downtown seattle has a 40% mode split for transit
very supportive public
so much so that they are asking why we can’t put light rail on SR520 and not just I90
Lake Washington is cultural and physical divide for king county
22 miles long, significantly constricts north south transportation and east west travel
two floating bridges across
so bottlenecks for transportation
and we say freight planning is a huge component and factor in anything we do: we want to help get people out of their cars make room for more trucks is good for our economy
east side and west side politics too: difficult to make decisions about investments about that lake
1976 Memorandum
– landmark agreement that everyone has referenced in implementing I 90 projects
– promised people of the region that the I90 would be built to convert part of it to high capacity rail eventually
– I90 was high priority for high capacity transit and SR520 would follow as the need grew
Lots of things happened between 1976 and 1998
– but v impt part was study with WSDOT and Sound Transit
– said I90 was highest priority for high capacity transit
2004 memorandum agreement
– added Sound Transit as signatory, and decided ultimate configuration for I90
2010
– announced preferred alternative for 520
I 90 East Link Light Rail
– connects downtown Seattle, Mercer Island, Bellevue, Redmond via I90
– want to provide HCT/light rail in the centre of I90
– commitment to keep the bridge viable though
Areas of advanced design (ie: places where people are concerned about)
– Floating bridge loadings: making sure the added load from light rail doesn’t mean a loss of the freeboard — ie make sure the bridge doesn’t go down any lower in the water
– work through mitigation in 2001, and worked through load verification tests in 2005 — semis on bridge simulated weight of LRT
– Rail expansion joints – prototype joint to be fabricated this summer – no example –
– Stray current control: electrical isolation on bridge deck – track isolation monitoring system
– Installation on bridge deck – dense fabric of reinforcing steel and post- tensioning cable
– Maintenance access – coordination of WSDOT and ST maintenance responsibilities required — WSDOT needs access to the pontoons daily to maintain them
SR 520 HOV & Bridge replacement project background
– current bridge built in 1960s
– replacement planning in 1990s
– project is 12.8 miles, and $4.65 billion
– neighbourhood controversies: tied to congestion and noise and lack of reliability across the facility — legislative working groups
– Useful life — bridge is nearly 50, may sink with high wind or earthquake
– Functionality — no shoulders, no transit priority, no ped/bike access, daily gridlock
– Neighbourhood concerns
High Capacity Transit Plan for 520
– Plan: ST/WSDOT/KC Metro/UW Plan – 5 core BRT routes — but only partially funded
– Connectivity & Integration: connects to UW light rail station and medical center
Bridge Replacement Preferred alternative
– tolling
– Cross Section — light rail ready, bike/ped facility, transitHOV3+ center lanes, two GP lanes in each direction
– West Side/UW transit components – westside/UW transit components, connectivity & priority, bus stops on montlake lid, bridges, etc
I90 East Link light rail — increase transit ridership by 25-33%
– 45-50,000 riders per day
– 25% ofall travel across lake will be in transit
– 30 min travel time savings compared to auto
– carrying capacity in peak period equivalent to 7 highway lanes
SR520 Bus Rapid Transit
– travel time decreased and reliability increased etc
Denver’s FasTracks Program – Rick Clark
– Richard F. Clarke, Assistant General Manager Capital programs, RTD, Denver CO
everybody wanted rail line and wanted it right away
– 2002-2003 – developed plan, 100% board support, public vote in 2004 to fund program, 0.4% sales tax increase — 0.6% was existing tax for base system — four cents for every $10 spent
Think like a region, act like a region!
– unanimous support from all 31 mayors in the enver area and the MPO
– strong campaign w/ professional campaing team
– strong support from Denver Metro Chamber, industry, environmental groups, business community
– no voter remorse after
The importance of regionalism
– to become a great city you need to be a great region
– major trip attractions, etc
FasTracks plan insights:
– All previous lines built on time, on budget
– First three lines exceeded ridership projections
– Developed a sound financial plan
– Utilize bottom up planning and engineering: told them exactly where things would go and even said headways, and made public involvement a priority: hundreds of meetings held
– Key message was number of jobs created: $2.9 billion put into Denver economy
– Future growth: population grows 1 million by 2025
articulate vision of the future for transportation and smart growth — gives regional choices to citizens of district
– developed TOD strategic plan – 75% of the 57 stations conducive to accommodating TOD
– respond to attacks rapidly – complement, not compete with car
– uphold professionalism
– hire a good campaign team: it’s well worth it!
Challenges
– economy (launched project in worst economy since world war II – sales tax brought in billions less only $7B when $15B projected — so will not be able to complete full project by 2017)
– budget
– schedule
– railroad negotiation
– right of way acquisition/eminent domain
FasTracks Strategies
focus on strategic, regionally important elements (ie: airport corridor and eagle P3 project)
– first idea was to build short segments on every track and extend them whenever you could: but the little stubs didn’t make sense from a planning context: a bunch of lines to nowhere
– our long term consideration is that we may go out for another tax increase
– ended up focusing on airport line — the region can intuitively understand this
– took a lot of courage on the part of the board to make that call
– getting a $1.7 billion dollar private investment
– marshal lines that make the most sense and when we do that we have momentum for the others
– continuing to develop reliability of cost estimates (advanced engineering, independent estimtates, conclude railroad agreements)
– regional task forces to review assumptions — brought in critics to be a part of the process: sales tax, construction inflation, continued annual oversight by DRCOG
– lessons learned report- we spent a lot of time defending what we did and now we use it quite a bit to help guide our decisions
– focus on construction:
– and in all caps, the FasTracks mantra:
BUILD AS MUCH AS WE CAN, AS FAST AS WE CAN, UNTIL IT IS ALL DONE
Construction progress
– 47 miles of new rail lines to be under contract or in construction by the end of the year
– funding from FTA etc
Reshaping Transit Planning in Metro Vancouver through Dynamic Illustration, Solid Evidence and Careful Conversations – Mike Shiffer
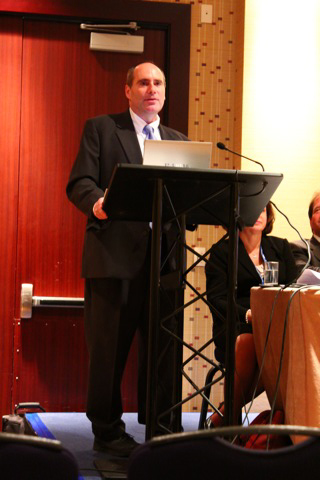
– Dr Michael Shiffer, VP Planning, Strategy , and Technology, TransLink Burnaby BC
Grew up in Chicago in family without a car
So always had great affinity for public transit
Presentation outline:
1. translink and metro vancouver region
2. recent developments
3. transit oriented communities in metro vancouver
4. land use and transportation connection
5. station area approaches
6. steps taken to leverage existing resources
7. some lessons learned
1. TransLink — is an intermodal transportation authority
– we do buses, trains, rapid transit, ferries, but also major roads and bridges
– our revenue: 1/3 transit fares, 1/3 fuel tax, 1/3 property tax, and a bit from parking sales and other associated sources
– where do we spend? half on bus operations, 20% on rail, 20% on debt service supporting capital programs, and other mechanisms
– Metro Vancouver expecting to grow still – 1M more by 2040
– lots of it will take place in the South of Fraser river
– also a challenging place to serve with transit — it tends to be more suburban in character, low density place
– dual responsibility — helping to shape further development but also tasked to serve existing demand
– dealing with shift of travel pattern
– in terms of how people travel around the metro area — the peninsula we’re on is huge in terms of density, but only 33% of trips are done by single occupancy vehicles — in city of vancouver proper it’s 50/50, and in the region, three quarters are in single occupancy vehicle and 1/4 is walking/biking/transit
We’re tracking in the right direction
– ridership has increased 52% between 1998-2009 while population increase is 15%
– service hours have been growing but so is ridership
2. Recent developments
– fleet renewal: bought new buses: diesels, hybrids, CNG buses, electric trolleybuses — conventional and articulated; community shuttle (unusual to see them in dense areas but they work quite well); new vehicles for SkyTrain
(Mike shares an aside: after coming from chicago — automated trains running every 108 seconds is a thing of beauty. same with seabus — ferry that is wonderful — in 3 min 300 people get on, 300 get off, it’s a sight to behold)
– accessibility: creating greater level of accessibility for those with disabilities but those who shop or who have kids etc
– Canada Line – we were meant to get to 100,000 by 2013, and we’ve hit it in the first few weeks – spike in the graph is the Olympics
– roads: major roads and bridges are in the portfolio – most significant piece is Golden Ears Bridge — paid for i toll revenue
– Winter Olympics: keys to success were maintaining an effective fleet, having a young fleet, having a lot of buses in your back pocket
3. What makes for transit oriented community?
– places facilitating a decreased reliance on driving by focusing on high er density deevelopment, diversity of uses, peedestrian friendly design, within walking distance of frequent transit
– they are really pedestrian oriented communities connected by transit
– uses Home Depot on Cambie as example — parking buried, residences on top, Home Depot in middle
– benefits: more cost-effective transit service, higher quality transit service; improved public realm and livability (City Square as example: quite hidden from sight and unobtrusive)
5 “D”s – Building transit-oriented communities
– What we ask land use partners to pay attention to…
1. Destination — Be on the way!
2. Distance to transit – 5-10 min
3. Desity – highest densities adjacent to the station area with densities stepping down
4 Diversity of uses
5. Design – be vibrant, pedestrian/bike friendly, must be nice around stations
4. Land Use and Transportation Connection
– more strategic approach to land use and transportation
– supply side & demand side
– two documents: Regional Growth Strategy (from Metro Van) & Transport 2040
– urban centres identified, and we complement that with a frequent transit network — at least every 15 min throughout the day, 7 days a week
– framework for conversation around transit and land use coordination
transit service types
– FTN limited stop with exclusive ROW (fixed guideway: SkyTrain)
– FTN limited stop: limited stop bus lines (99 B-Line)
– FTN local stop: running about every 10 minutes or so (every 2 blocks or so)
– local stop
with that family of routes you can put that together and you get a frequent transit network
that said we’re looking on how to build on that
ongoing conversation and a number of people are deeply engaged in this
evergreen line is extension to north east of system
who have been waiting for transit, built dense centres and express bus service
commitments in funding from province and federal govt and are working with municipalities to sort that out
also planning studies — alternatives analyses for a number of other corridors
in the south, in surrey
and looking to serve UBC
we have dual responsibility to shape existing demand
shaping down here
Sometimes helpful to define things effectively
– need dynamic illustration like time lapses
– queuing up for express bus — 99 lineup is about a city block
– variability of journey time throughout the day
– you have variability of a trip, as short as 28 min and as long as 44 min end to end for the 99 — thats not good
Alternatives analysis process:
– high level analysis –> many alternatives
– high level design and detailed analysis –> shortlist alternatives
– design –> preferred alternative
Public consultation
– important to have planners out there explaining how it might work
– important for public to grasp the issues
5. Brentwood — has a very busy roadway and parking lots and a car dealership
– so we are developing passenger facility and community design guidelines — soup to nuts
– we do this from a regional perspective — to neighbourhood to station parcel level
– station area programs – we partner with municipalities to better integrate station into community
– we can build something like a streetcar neighbourhood
Commercial-Broadway Transit Village plan
– will have to go into that station when we expand service so may be opportunity for creative development
6. Leveraging existing resources
– when we talk about extending the system
– also impt to talk about using the system more efficiently
– smartcards: leverage that data so you can see how the ridership performed over the course of a year or a day
– looking to leverage that
– buses serve as important data collection devices — put auto passenger counters on buses in Chicago to get a better sense of data — are partnering with CMBC to do the same thing
– and can tie this into Google Earth, and see the bus line ridership — useful as we know how to rationalize service more effectively
7. Some lessons learned
1. land use and multimodal transport are interdependent
2. weave elements of land use transportation plan requires careful coordination at multiple scales
3. conversations on expansion are supported if you can demonstrate efficiency and effectiveness
4. dynamic illustration, solid evidence and careful conversations cna support a planning process.


Denver is building 47 miles of lines. Vancouver might not build another 47 miles before the year 2090 unless we change our thinking. Building on existing railway lines and the middle of streets costs a small fraction of elevated guideways and subway tunnels.
You can have a look at the FasTracks website for more info too: http://www.rtd-fastracks.com/
The project is very ambitious: the plan calls for 122 miles over 12 years, at a estimated cost of $6.9 billion (as of 2009)!
http://www.rtd-fastracks.com/main_32
@David, Denver has 56 km of LRT with a daily ridership of 62000.
Skytrain has 68 km of track with a daily ridership of 345000.
IMO we can’t generalize the needs for different corridors in different cities.
http://en.wikipedia.org/wiki/List_of_United_States_light_rail_systems_by_ridership
http://en.wikipedia.org/wiki/SkyTrain_(Vancouver)
Thank you so much Jhenifer for all the work you put into these reports from the APTA conference. It’s fascinating reading.
One thing did jump out at me and I wonder whether you could wrack your memory to add some more information. In the recent developments part of Mike Shiffer’s presentation there is a line that reads “new vehicles for SkyTrain
coming from chicago” Any way you can provide some illumniation?
Thanks again!
Oh: at the “coming from chicago” point, Mike just shared an aside about really liking the automated SkyTrain, since in Chicago he hadn’t had that system. I will amend to make that more clear!
On an unrelated note, I’ve noticed that some of the Mark I’s have “ghost interiors” and some don’t even have the chime sound, are they being refurbished to mimic the new MK2’s, just as they did with the previous MK2’s?
Thanks for the links Jhenifer. That’s one impressive project they’re planning: 140 miles of new BRT, LRT and commuter rail by 2017.
@ zack
People in Toronto are reporting that some TransLink Mark I cars are being sold to them for use on the SRT.
I found out that too!! Can’t Toronto ask Bombardier to build the newer Mark IIs than stealing our MKIs? This is outrageous!!! Somebody better dig deeper on this story.
UPDATE:
@David, It turns out that story could be a hoax.
The SRT track cannot accommodate Mark II cars. It was built to carry TTC streetcars and hastily converted to carry ICTS (SkyTrain Mark I) cars. Tearing down the old guideway and converting the entire line to low floor LRT was supposed to begin this year, but has been delayed until after the Pan American Games in 2015.
SRT operates using a fleet of just 28 Mark I cars and demand requires the entire fleet to operate in peak periods. TransLink has a much larger fleet and never operates the entire fleet so a car needing repair doesn’t impact service like it does in Toronto.
If Scarborough really does need additional Mark I’s for the next 5 years there are only two possible sources: Detroit with just 12 cars and Vancouver with 150.
zack: Ghost interiors? Can you be a bit more specific?
As far as I know, none of the Mark Is are being updated with new interiors to match the new Mk IIs.
Someone had asked about the Mark Is being sold to Toronto — I’ve asked SkyTrain but hadn’t heard back on that yet. But as far as I know, we need every train we can get to keep up with growing demand, and our trains are in excellent shape: I can’t imagine why we would suddenly sell them off!
When I mean “ghost interiors” I mean the doors and sidebars which usually are painted red are white, which is the exact same color used on the TTC Mark Is.