More trips in Metro Vancouver, and more bike and take transit: initial findings from our 2011 trip diary survey
More trips in Metro Vancouver, and more bike and take transit: initial findings from our 2011 trip diary survey
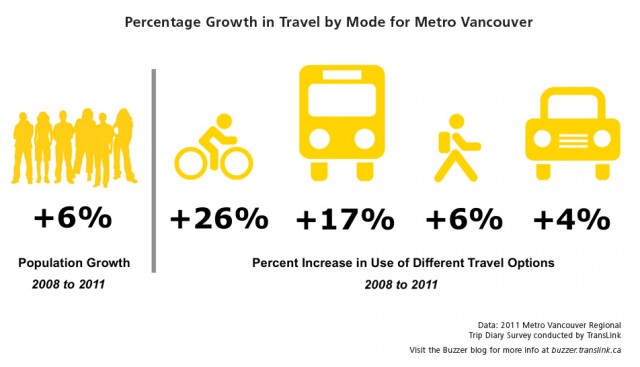
Guess what? In 2011, more people were taking trips around the region, but more and more are taking transit and cycling. Those are just some initial conclusions from our 2011 Trip Diary survey that we’re able to share today!
The trip diary, which draws data from over 22,000 households in our region, is a survey we do every three to four years to get a “snapshot” of a day of Metro Vancouver transportation. We’ve been analyzing the results of the 2011 trip diary now, and we wanted to share what we’re learning about the region with you over the coming weeks and months!
The first set of analysis we have is about regional mode share—or how popular each method of transportation is in our region. Here are some of the highlights we pointed out in our press release today:
People in Metro Vancouver are choosing sustainable transportation for more of their trips, but cars still account for the majority
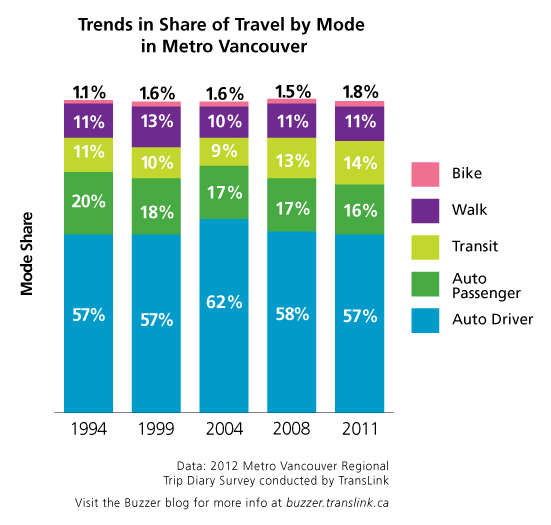
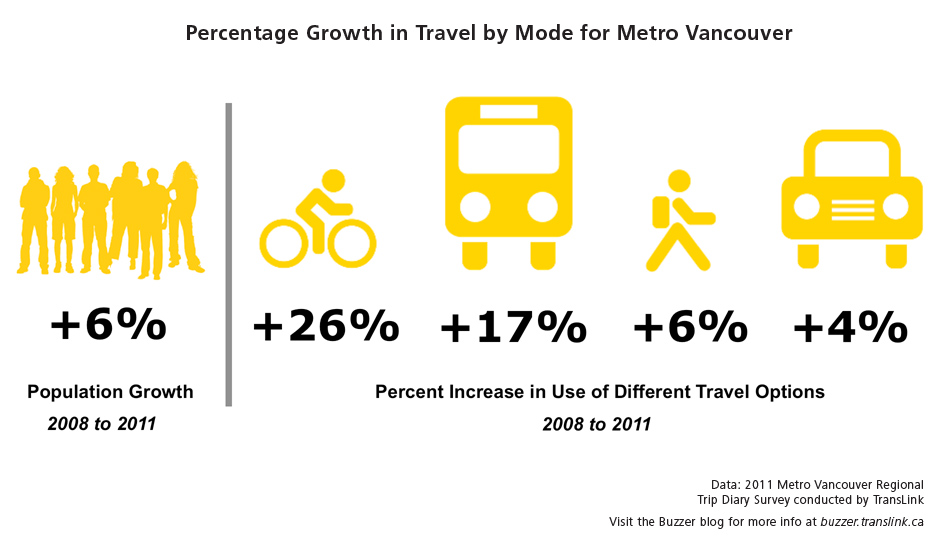
- Transit use as a proportion of all trips increased to 14 per cent in 2011 from 13 per cent in 2008 — there was a 17 per cent increase in the total number of trips taken on transit. While transit mode share is 14 per cent, the survey found that 19 per cent of people used transit on any one day and 52 per cent used transit in the past month.
- Cycling trips accounted for 1.8 per cent of all trips – its highest region-wide mode share yet, and a 26 per cent increase since 2008.
- Trips taken by walking stayed at 11 per cent.
- The share of people using cars for their trips is down from 2008, but cars still account for the majority of trips: 57 per cent by drivers and 16 per cent by passengers (from 58 per cent and 17 per cent respectively).
Demand for transportation continues to grow – there are more people making trips and individuals are making slightly more trips
- A total of 6.1 million trips were taken on a typical fall weekday last year – 5.9 per cent more than in 2008, slightly higher than the increase in the region’s population (5.8 per cent) over that time.
- People are making more trips per day – 2.77 trips, versus 2.70 in 2008.
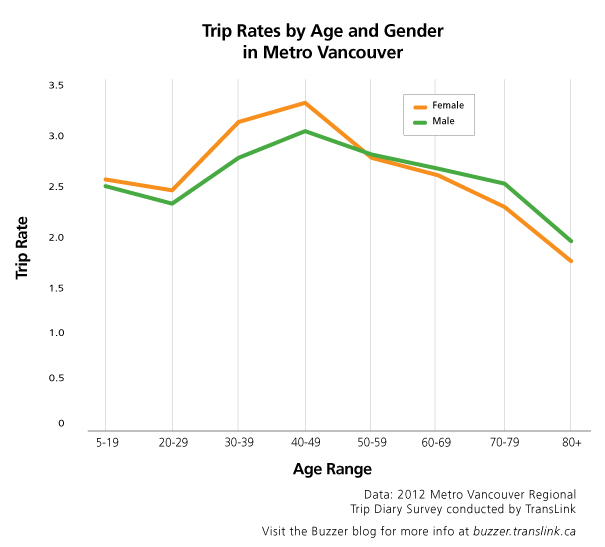
- People in their 40s had the highest average number of daily trips – 3.5 for women, 3.1 for men; likely due to increased family activities at that time of life.
It’s a positive trend, but it’s still a long way to go to achieve the region’s long-term transportation goals (outlined here in Transport 2040).
The full briefing paper and graphs for sharing
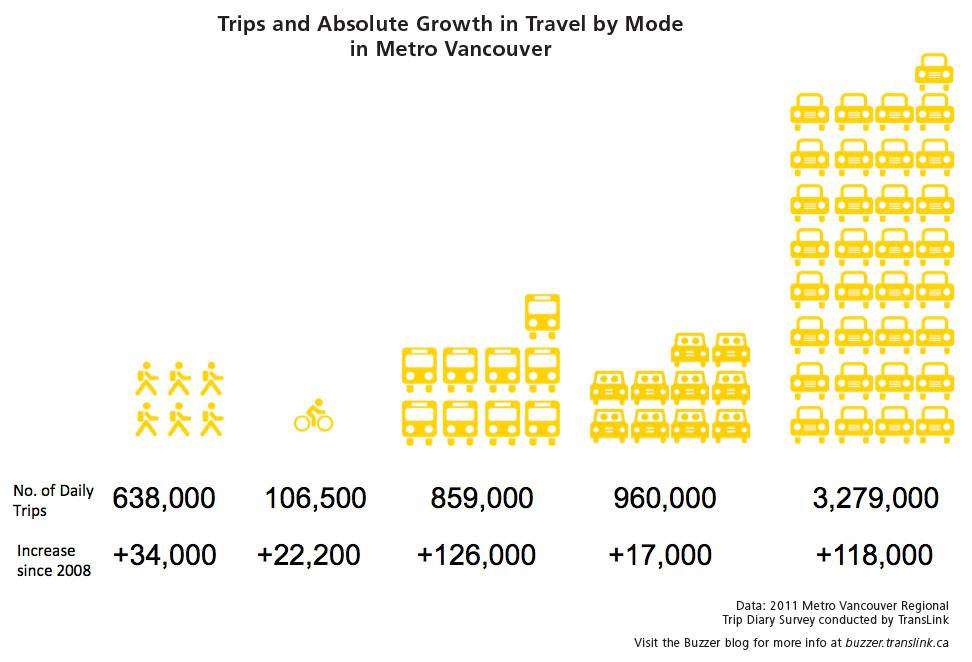
For all the details, download this in-depth briefing paper, which shares the analysis we’ve done regarding regional mode share based on the trip diary results. You can also see (and share!) these spiffy graphs developed from the info below. (Click to enlarge each one!)
It’s all very useful to know how our region’s doing, especially as we’ll be discussing our 30-year long-range transportation plan in the coming year or so. Feel free to ask us any questions!




I would like to see this data separated by municipality. I strongly suspect that the data gathered from people polled in the City of Vancouver is propping up these figures and skewing the data in such a way to even render much of it unusable.
Let’s see here, the population has increased by 6% from 2008 to 2011, but the number of vehicle trips took 17 years to drop a mere 4% per capita. This means that from 2008 to 2011 there was actually a substantial increase in the number of vehicles on the road and the data also seems to imply that this can be applied further back to 1994. While it’s well known that vehicle trips downtown have slightly decreased, the same just can’t be said for other areas.
The number of trips taken on transit appears to have increased, which is good, but trips taken while being a passenger in a vehicle have dropped… substantially. This tells me that that carpooling continues to be largely ignored. Carpooling is a great way to long distance vehicle trips in areas that are not well served by transit. However, because the data is not separated by municipality, it can be hard to decipher. Did increasing transit use in the city of Vancouver outweigh any gains made in carpooling elsewhere? This data-set doesn’t say.
The gains made in cycling are very impressive, but I suspect that much of this increase has actually come from within the city of Vancouver. Again, with the data the way it is, all we can do is make educated guesses. I imagine that cycling has increased across the board, but nowhere near as much as the chart implies when it comes to areas like Surrey, Langley, or Delta.
What does all this mean? Not too much. The data is too vague to come to any firm conclusions except the usual ‘vehicle trips need to be reduced’ and ‘foster a culture of transit use’. Nothing we’re no stranger to here on the blog.
So this is completely unrelated to the topic, but I wanted to share it here. This is in regards to the attire worn by a transit Police Officer, and his related conduct. I wish I had taken a picture, so bear with me as I describe this guy.
This “officer” was on patrol on Skytrain tonight at 29th Avenue. He’s a short guy, with a scowl and some facial hair. He was wearing civilian clothing: black pants and a dark jacket (leather I think), no clear ‘POLICE’ markings. Oh but it gets better: he was wearing a black toque and had his shield on a chain around his neck.
That might not sound bad, but he looked like he was part of some anti-gang LAPD unit from 1997. Remember Denzel in Training Day? Yeah like that. Someone forgot to tell this guy he’s securing the TRANSIT system! He clearly has delusions of being a major crime squad detective.
His “tough guy” attitude was even reflective of his appearance. They way he sauntered about and stared at people like he owned the place. He just casually leaned into the train I was sitting in and looked everyone over — worse still is that he WASN’T looking for problems; he just wanted to be noticed.
It’s painfully obvious this clown is looking for some “action”. Whether it’s to rough-up a “perp” or maybe discharge his weapon, he CLEARLY romanticizes and brandishes the power afforded to him by his position.
You might think I am overreacting here, but this is unacceptable. Do you see the RCMP or any City Police officer looking or behaving like this? No because to them it’s a duty, not a lifestyle.
I urge Translink and the Transit Police to reel this guy in or give him the boot. Before he does something stupid.
They’re Transit Police, not the RCMP, what do you expect? When you give a bunch of glorified security guards a gun and taser, that’s just how they’re going to behave. The problem is one of training and discipline across the board, not one lone renegade.
I’ve had to deal with one overzealous transit police ‘officer’ who couldn’t be bothered with reading the signs for a section of road he was enforcing. I keep my expectations of these people low so I don’t get surprised or disappointed when I hear of stories like this or when I read about them in the newspaper.
To be honest, the same is true of many city police across Canada. The only time you’re going to find quality policing is usually with the RCMP. RCMP undergo a rigorous training regimen that involves a great deal of time at an academy in Regina. The discipline and training that local police undergo doesn’t even come close to the quality we’ve come to expect of the RCMP.
Cliff: subregional data will be coming up in future trip diary releases! Stay tuned :)
[…] has begun to release the results of their 2011 trip diary survey of 22 000 households in the region. While cars are still the […]
[…] you might remember from last week’s post about popular modes of travel in the region: we do a trip diary survey with over 22,000 households in our region every three to four years, […]
I have a hard time squaring this with other Translink data. The diary indicates 859,000 weekday transit trips, that is 311 million trips a year if every day were a weekday and 273 million trips a year with a more realistic 320 multiplier. However, Translink Data show 225 million trips in 2011. These data sets just don’t match. Were diary takers very clear about trips versus boardings, or is Translink data accurate? With some of the crammed buses, I’ve wondered how well the ridership has been counted.
yvrlutyens: I passed your question on to our planning department and here’s the response they sent along.
[…] that invest in bike lanes have seen marked growth in ridership. In Vancouver, bicycle trips went up 26 per cent between 2009 and 2012 according to TransLink, and Montreal saw similar growth, with people making […]
[…] that invest in bike lanes have seen marked growth in ridership. In Vancouver, bicycle trips went up 26 per cent between 2009 and 2012 according to TransLink, and Montreal saw similar growth, with people making […]
[…] that invest in bike lanes have seen marked growth in ridership. In Vancouver, bicycle trips went up 26 per cent between 2009 and 2012 according to TransLink, and Montreal saw similar growth, with people making […]