How did TransLink’s buses perform in 2012? Our new report has all the details!
How did TransLink’s buses perform in 2012? Our new report has all the details!

The latest review of TransLink’s bus system is out today!
It’s a report called the 2012 Bus Service Performance Review, and it shows that bus ridership increased in 2012, while costs per trip dropped. That’s good evidence that our bus service is more cost-effective than ever, and that our bus service optimization measures are working.
To get really specific on the numbers: we’ve found the number of bus trips taken per revenue hour has increased 3.4 per cent, while the average cost per trip dropped by 2.2 per cent. Please do check out the full review if you’d like the all the details and stats!
About the Bus Service Performance Review
We first produced a Bus Service Performance Review in 2011, and now every year we examine bus data to track to understand trends in ridership and bus productivity.
With buses making up more than 80 per cent of TransLink’s transit services, the review is a key tool to inform service optimization, or evidence-based decision making on how to best use bus resources—a process that involves extensive public consultation.
The review examines three key indicators on three levels: the entire system, eight sub-regional areas, and for every bus route. Have a look at our Bus Service Performance Review Document Library to see current and past reviews, plus detailed reports on every route in the system!
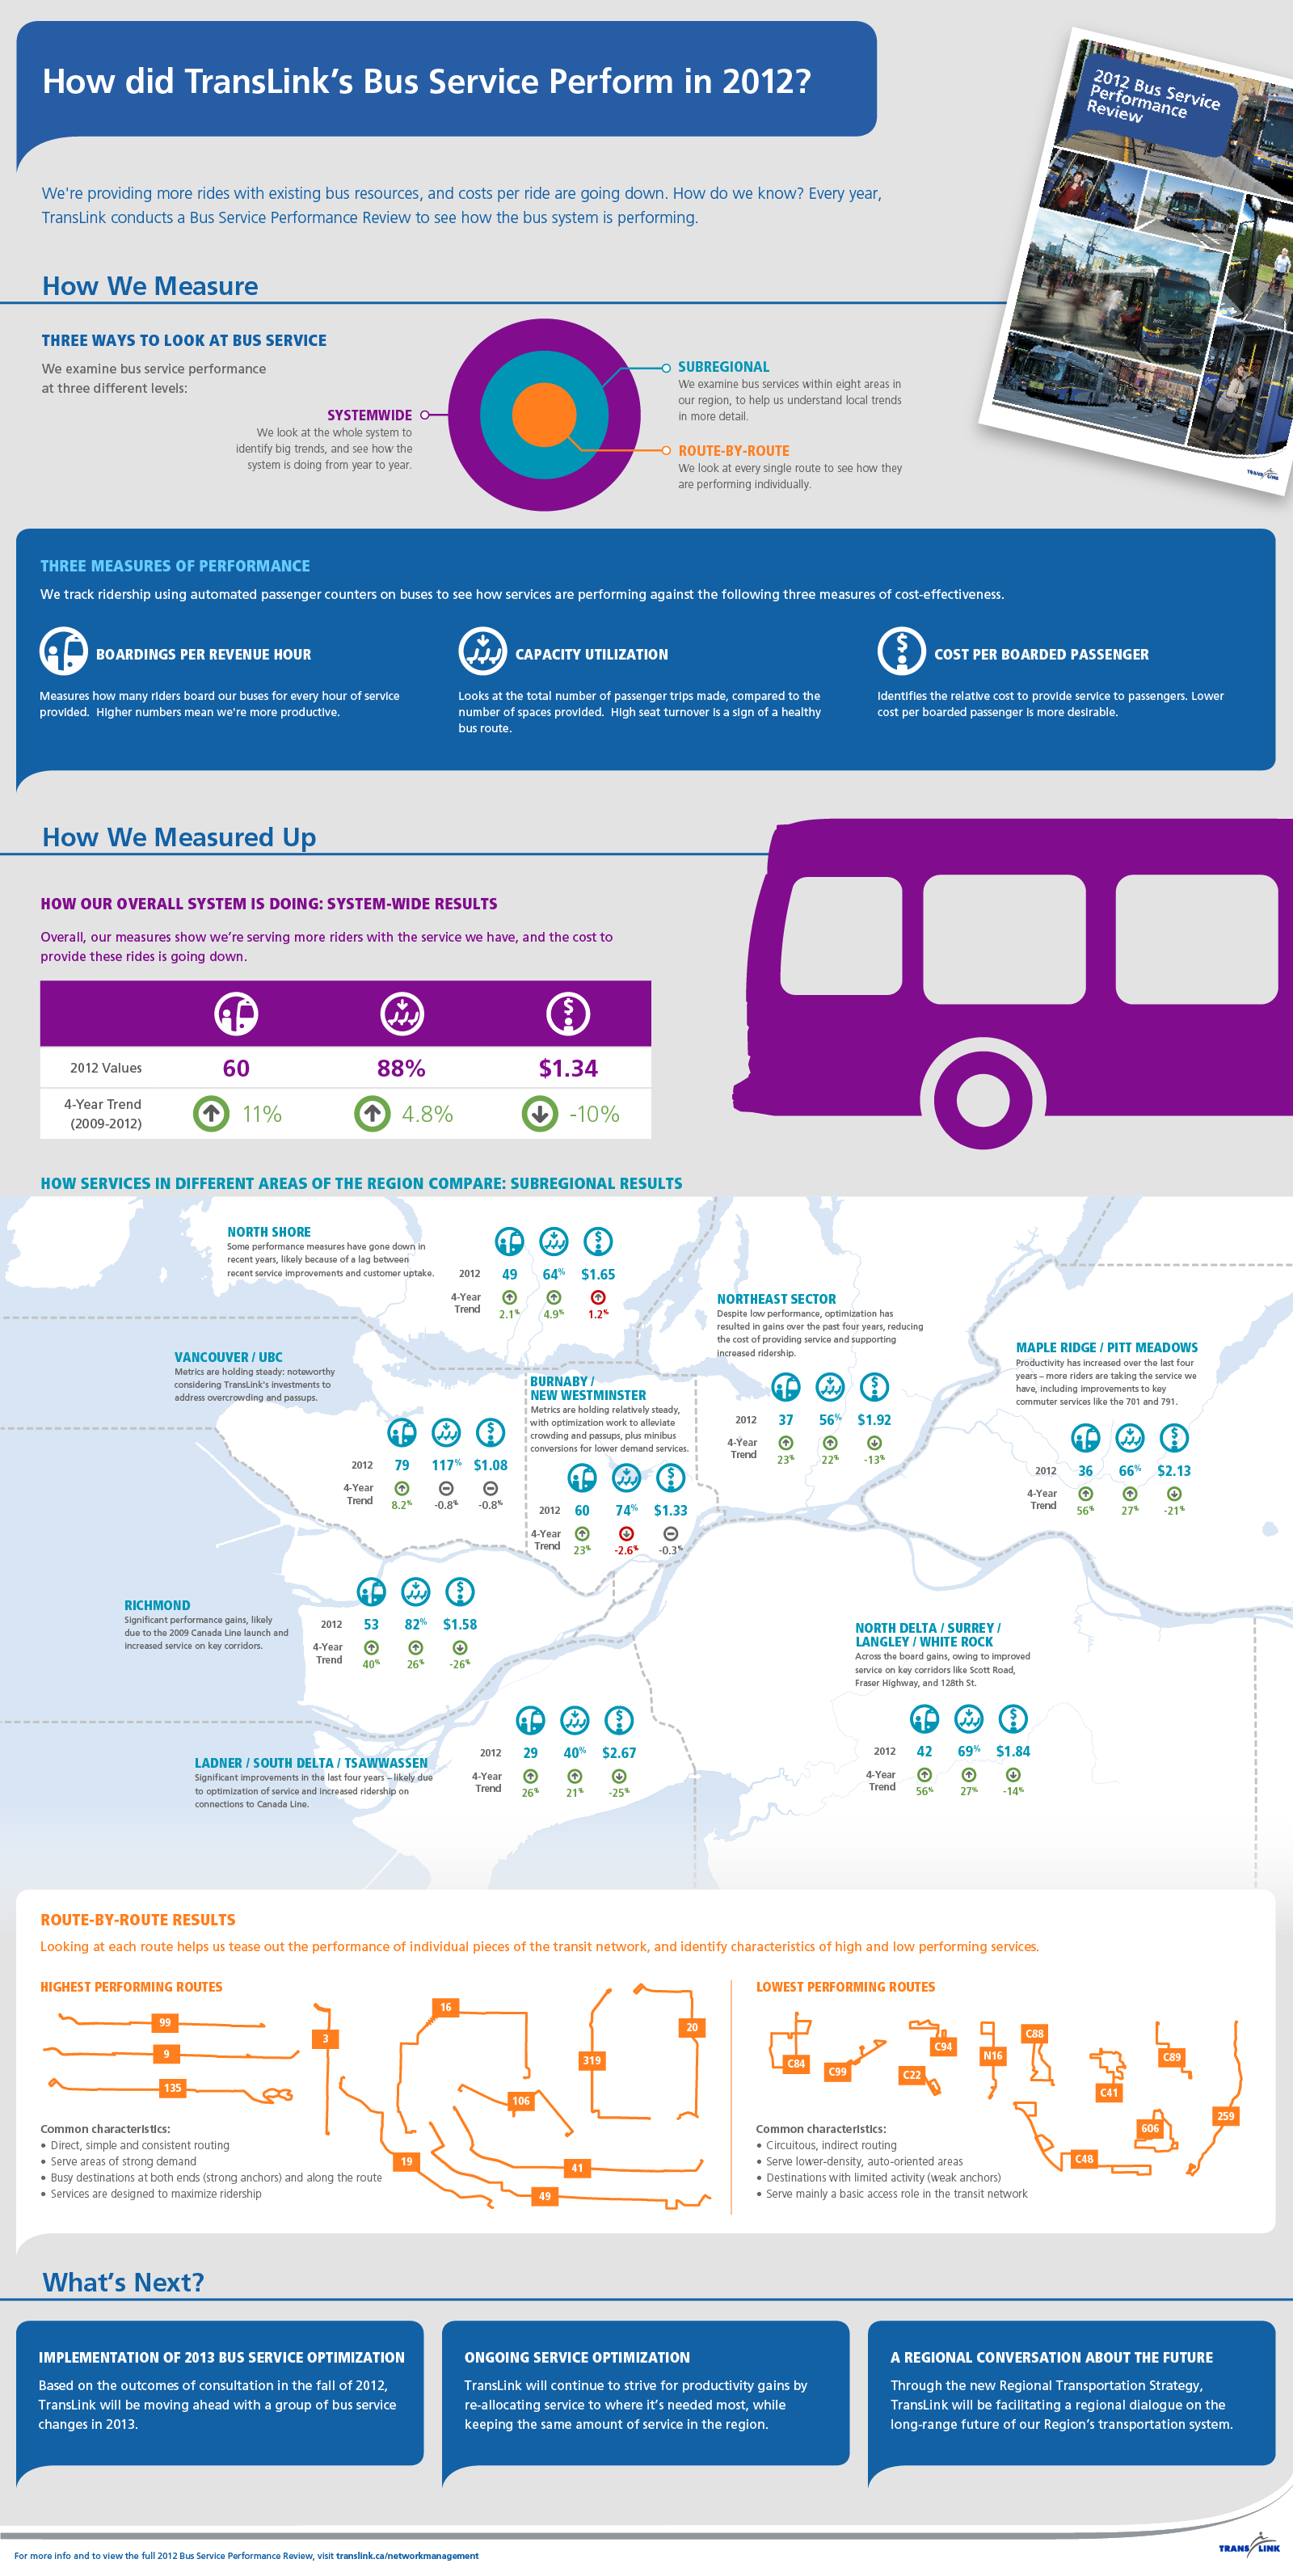
Read on to see a handy infographic that describes our overall results. Take a read and feel free to share it with others!


The review shows low ridership on some of the Community Shuttle routes out in Tsawwassen, and I would suggest part of the reason for that is poor connections with the #601 service…
It’s too bad that they don’t consider improving the #601 to at least every 20 minutes daybase, everyday, between Bridgeport Station and the South Delta Rec Centre. Then the #601’s could alternate by running hourly to 2 & 52 A, hourly down to 1 A & 67 (Replacing the C#89) and hourly around Tsawwassen as either a local #603/604 (Replacing the C84), and greatly reduce the number of transfers for area residents…
As for “low ridership” on the C88 & #606 routes around Ladner, go back to the old style-original hourly full #606 routing, and hourly full #608 routing during daybase around Ladner…
Hi Sean: I passed your question along to our service planning team and here’s the response.
I noticed that Surrey and Delta’s #319 got on the good list. Good for us/them!
I also noticed that the “suburbs” were the only communities that had only-improvements. That certainly is a credit to the planners and Translink. I think that a small honourable mention should go out to the riders for making use of those improvements.
I congratulate Translink, and look forward to more changes.
[now for the bad stuff; you knew that it was coming] I think that it should be pointed out that even though the cost per passenger went down, the fares went up! We take transit to be gentle on the environment, to save money, to live a convenient lifestyle, to access opportunities, and for fun. I certainly support the company’s desire to make more money, but I don’t see the need to raise fares just for gas, when bringing in more passengers should the first goal.
This blog post and this graphic show that Translink leans heavily on the planning and scheduling department for income: “Need more money? Great! Let’s get the planning department to change the system!”. That certainly should be where we go to, but what about the marketing department?
Why isn’t the next stage filling the shuttles in Maple Ridge? Why isn’t the next stage building ridership on significant connecting buses like the #555 and #595?
If we must lean on the planning department, then why don’t they spend more time realigning the #326, so that ridership can grow?
Why is the late evening service so infrequent, even though many buses all ready go in my direction?
That being said, this blog post and graphic serve the community well, in that they assure us of the long term growth of transit?
Hi Eugene, here’s the response to your comment from service planning.
Oops: that last sentence was meant to be a statement and not a question.
I’m seeing a lot of routes that could do with being converted to shuttle buses to decrease costs and shunt the freed up 40 foot buses to routes that actually need them. Lots of them seem to be in Burnaby and North Vancouver. Even something as vital as the 123 on Sundays has capacity utilisation lower than that of routes in South Delta. If the demand isn’t there, switch out the buses. It’s not like it can’t be later reversed. Buy more shuttle buses (or even 30 foot buses like the ones in Whistler) and save the conventional buses for routes that actually need them.
Hi Joe: here’s the response from our service planning team.
I’m going to copy what I wrote on the Northeast Sector Area Transit Plan post last week:
“Translink knows what the problems are … indirect, slow routes that form an illegible, infrequent network. … It’s time to switch from the timed-transfer system with its wobbly routes and lengthy, planned delays to a simpler, shorter, more frequent network that follows from the arterial grid.”
That describes the problems with the bus network pretty much everywhere in Metro Vancouver outside of Vancouver.
This pretty much proves that. Look at all the Highest Performing Routes and the top common characteristic, and then look at the same for the Lowest Performing Routes.
So I second what Eugene says – want more money, go to the planning and scheduling department(s) and start fixing up the mess of routes in Burnaby and New West. That’s bound to free up some service for other areas that are sorely lacking in bus service.
Hi Sheba: here’s the response from our service planning team to your question.
All that is good, the breaking per subregion is an interesting addition.
I have some questions
If you add up all the service hour tabulated in the BSPR, you will end up roughly at 3.5million hours ( did it on year 2011, but I guess it could not be much different in 2012, it roughly matches your GTFS by the way).
But, you deliver ~ 6million hours of bus service (see appendix 1 of your 2012 Financial and Performance Report, p35)
Where have disappeared the missing $1.5 million hours of bus service?
I assume it is dead-end trips and lay-over, but they are part of the operating cost of bus route, so it could be good to add that in your next edition….since I guess some route occurs with much more dead-end than others, and that can severely affect some routes
Furthermore, your BPSR assumes that the bus service cost $100h/hr,
…but your 2012 financial report states $624.1 Million of expense for the bus division (assumed to be all operational expense), that put the cost of bus at $125/hr…
(your last year BPSR was matching your 2011 financial report)
In fact, according to both, your GTFS (or service hours in your BPSR), and your 2012 Financial report, it costs ~$190 to provide effectively one 1h of bus service to customer….so almost twice what is stated in your BPSR (which suggest you are making money by the way!).
I did some stuff with your last year data at http://voony.wordpress.com/2013/01/14/some-more-translink-statistic/
Well, if you were providing all the data in an Opendata format (that is typically an excel or csv file, it could make thing easier for people)
Hi Voony! Here’s the response to your comment from our service planning team.
From a young transit user
Why can’t we have 60 footers in Surrey? Is there a problem with having 60 footers here? Sometimes I see 2 buses depart at the same time on the route. We seem to have packed crowds and in some cases the buses are full.
Or can we increase frequency on busy weekend rushes?
Hi Juan – here’s the answer to your comment from our service planning team.
According to this infographic and accompanying blog post, Translink’s planning and scheduling division is crucial to the company’s bottom line. Want more cash? Great!