Two regional travel studies show more take transit trips and more share car rides, among other things
Two regional travel studies show more take transit trips and more share car rides, among other things

We’ve just announced the results of the 2008 Trip Diary and 2008 Screenline studies, which are two surveys we do every few years to measure how people are getting around the region.
The Trip Diary survey asks people about their travel in the past 24 hours, while the Screenline survey captures how many vehicles pass key points in the regional network. Findings from these surveys (and a backgrounder on how they were conducted) can be found in this press release that was just put out.
Here’s a quote from the press release with some of the findings:
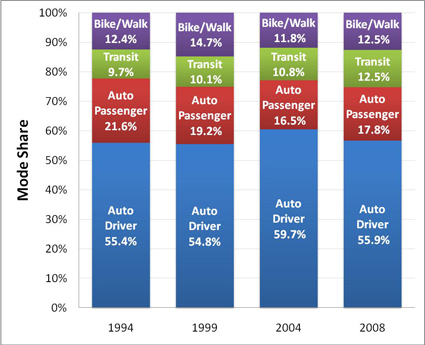
As “driver auto” trips have declined, the transit mode share has increased by 16%, while the population of Metro Vancouver went up by about 6%. The number of trips being made on public transit is steadily increasing over the past 10 years, with a 12.5% mode share in 2008, compared to 10.8% in 2004 and 10.1% in 1999. Also, the combination of all modes other than driving a car – transit, cycling, walking and riding as a passenger in a car – reached a share of about 44%.”
Changes in travel choice are helping the region to manage transportation more efficiently. The rate of trips per person on all travel modes in Metro Vancouver declined significantly from a peak of 3.24 per day in 2004 to 2.65 in 2008. This suggests people are combining more individual purposes into each trip, or “trip chaining.” This finding takes on even more meaning when one sees that the number of transit trips per capita has grown by one-third over the past 10 years – from 60 transit trips per person per year in 1999 to 80.
More people appear to be willing to share the ride, too, as the percentage of people using private auto as a passenger has increased from 16.5% in 2004 to almost 18% in 2008. The Screenline survey supports that observation, as vehicle occupancy increased from 1.19 persons (including driver) per vehicle in 2004 to 1.24 per vehicle in 2008, reversing a trend towards having fewer people in vehicles.
Also, for the info diggers, the Trip Diary and Screenline surveys were last run in 2004, and you can check out those results here: 2004 Trip Diary results (PDF), 2004 Screenline results (PDF). Just in case you would like to look through them!


Wow, despite what the blue box says, I don’t really see any change between the 4 columns…even after the huge amounts of fund infusions and transit expansions…
I guess I appreciate the new skytrain lines but I would have expected a bigger shift towards transit usage.
Very true. But I do still think it’s heartening to know the mode share is increasing for transit somewhat. Also, I should point out that the 2008 survey was conducted before the launch of the Canada Line, so we have yet to know the exact impact of the line through a Trip Diary study.
Can you post a link to the full 2008 study?
I’m not sure if it’s available online anywhere just yet: I know there’s still some sorting of the data being done. Let me check and get back to you.
Aha — turns out it is already on our website!
Go here: http://www.translink.ca/en/Plans-and-Projects/Transportation-Planning.aspx and there are links to the documents on the top right (see “related documents”).
And here are direct links to the documents, just in case:
2008 Trip Diary
2008 Screenline
I tried to download the report of the 2008 Trip Diary, but it is not in a format that any of my Apple or Windows-based software can open. Could you please send a PDF?
thanks
John