The Transit Service Performance Review results are in!
The Transit Service Performance Review results are in!
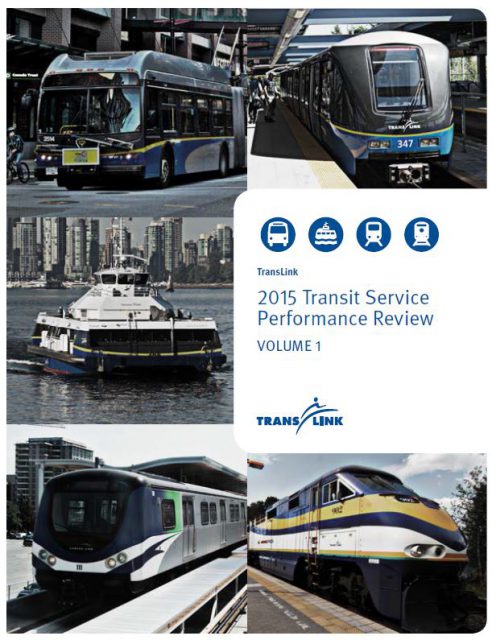
Today, we released the findings of the 2015 Transit System Performance Review (TSPR), a comprehensive review of ridership and service productivity for bus, SeaBus, SkyTrain and West Coast Express.
FYI: This is the first year the review has expanded beyond bus!
The TSPR gives us valuable information on boardings, ridership, transit trends and more. By monitoring services and ridership, we can respond to changing demands with available resources.
“The Transit Service Performance Review demonstrates how we are actively monitoring the transit system across Metro Vancouver to improve our performance. We know where we need to reduce overcrowding, improve travel speed and respond to changing customer demands,” said TransLink CEO Kevin Desmond. “The 2014 Mayors’ Council Vision sets out a blue print to tackle these needs and with sustainable investment, we can take action.”
Increasing Ridership
We had record ridership across the system in 2015 with 364 million boardings – that’s our highest ever!
Boardings remained high despite decreased per-capita service hours and slower bus speeds.
The annual review shows that ridership across the system continues to grow:
- Total system-wide boardings increased 2.1 per cent and total bus boardings increased 2.8 per cent, year-over-year. SkyTrain passenger volumes at Canada, Expo and Millennium line stations have also increased by up to 28 per cent.
- West Coast Express and SeaBus ridership remains steady. In 2015 there were 6.1 million recorded boardings on SeaBus; if it were a bus route, it would rank tenth highest in annual boardings!
Other trends identified during the 2015 Transit Service Performance Review include:
- Bus boardings in all sub-regions continue to grow or remain stable
- Some bus routes have consecutive years of growth in boardings, contrary to system-wide trend
- Almost half of bus revenue hours with chronic overcrowding occur outside weekday peak periods
- SkyTrain passenger volumes continue to increase
- Weekend passenger volumes on SkyTrain are similar to weekday volumes outside of peak periods
What happens next?
Knowing how our transit system performs helps to ensure that we are responding to changing customer demand with available resources and lays the foundation for future investment. The data from the TSPR shows us the need for transit investment in our region is high.
Transit ridership across the system continues to grow despite decreased service hours and service speed. The 2014 Mayors’ Council Vision sets out a blue print to tackle these needs and with sustainable investment we can take action. We are currently developing the 10-year Investment Plan which supports the 2014 Mayors’ Council Vision.
Based on the findings from the review, we’ve strategically allocated available resources to improve the experience for our customers:
- 15,000 revenue service hours were reallocated from bus routes with low demand to routes where customers need them most
- Service frequencies were increased to reduce overcrowding on a number of routes, including the 49, 100 and C23 in Vancouver; C28 in the Northeast Sector; 335 and 351 in the South of Fraser; and 403 and 410 in Richmond.
- Improvements were also made to the NightBus network to provide extended service hours and increased frequency.
Did you know?
Thirty per cent of trips on the system involve a multi-modal transfer (almost all are bus to SkyTrain transfers).
SkyTrain ridership at individual stations has grown by up to 28 per cent. The stations where ridership is growing the fastest are Canada Line stations that have experienced significant redevelopment, including:
- Olympic Village (driven by new, mixed-used development)
- Templeton (driven by new, McArthur Glen outlet mall)
- Marine Gateway (driven by new, mixed-use development adjacent to the station)
Want to learn more? You can read the full report here.
Author: Jessica Hewitt


