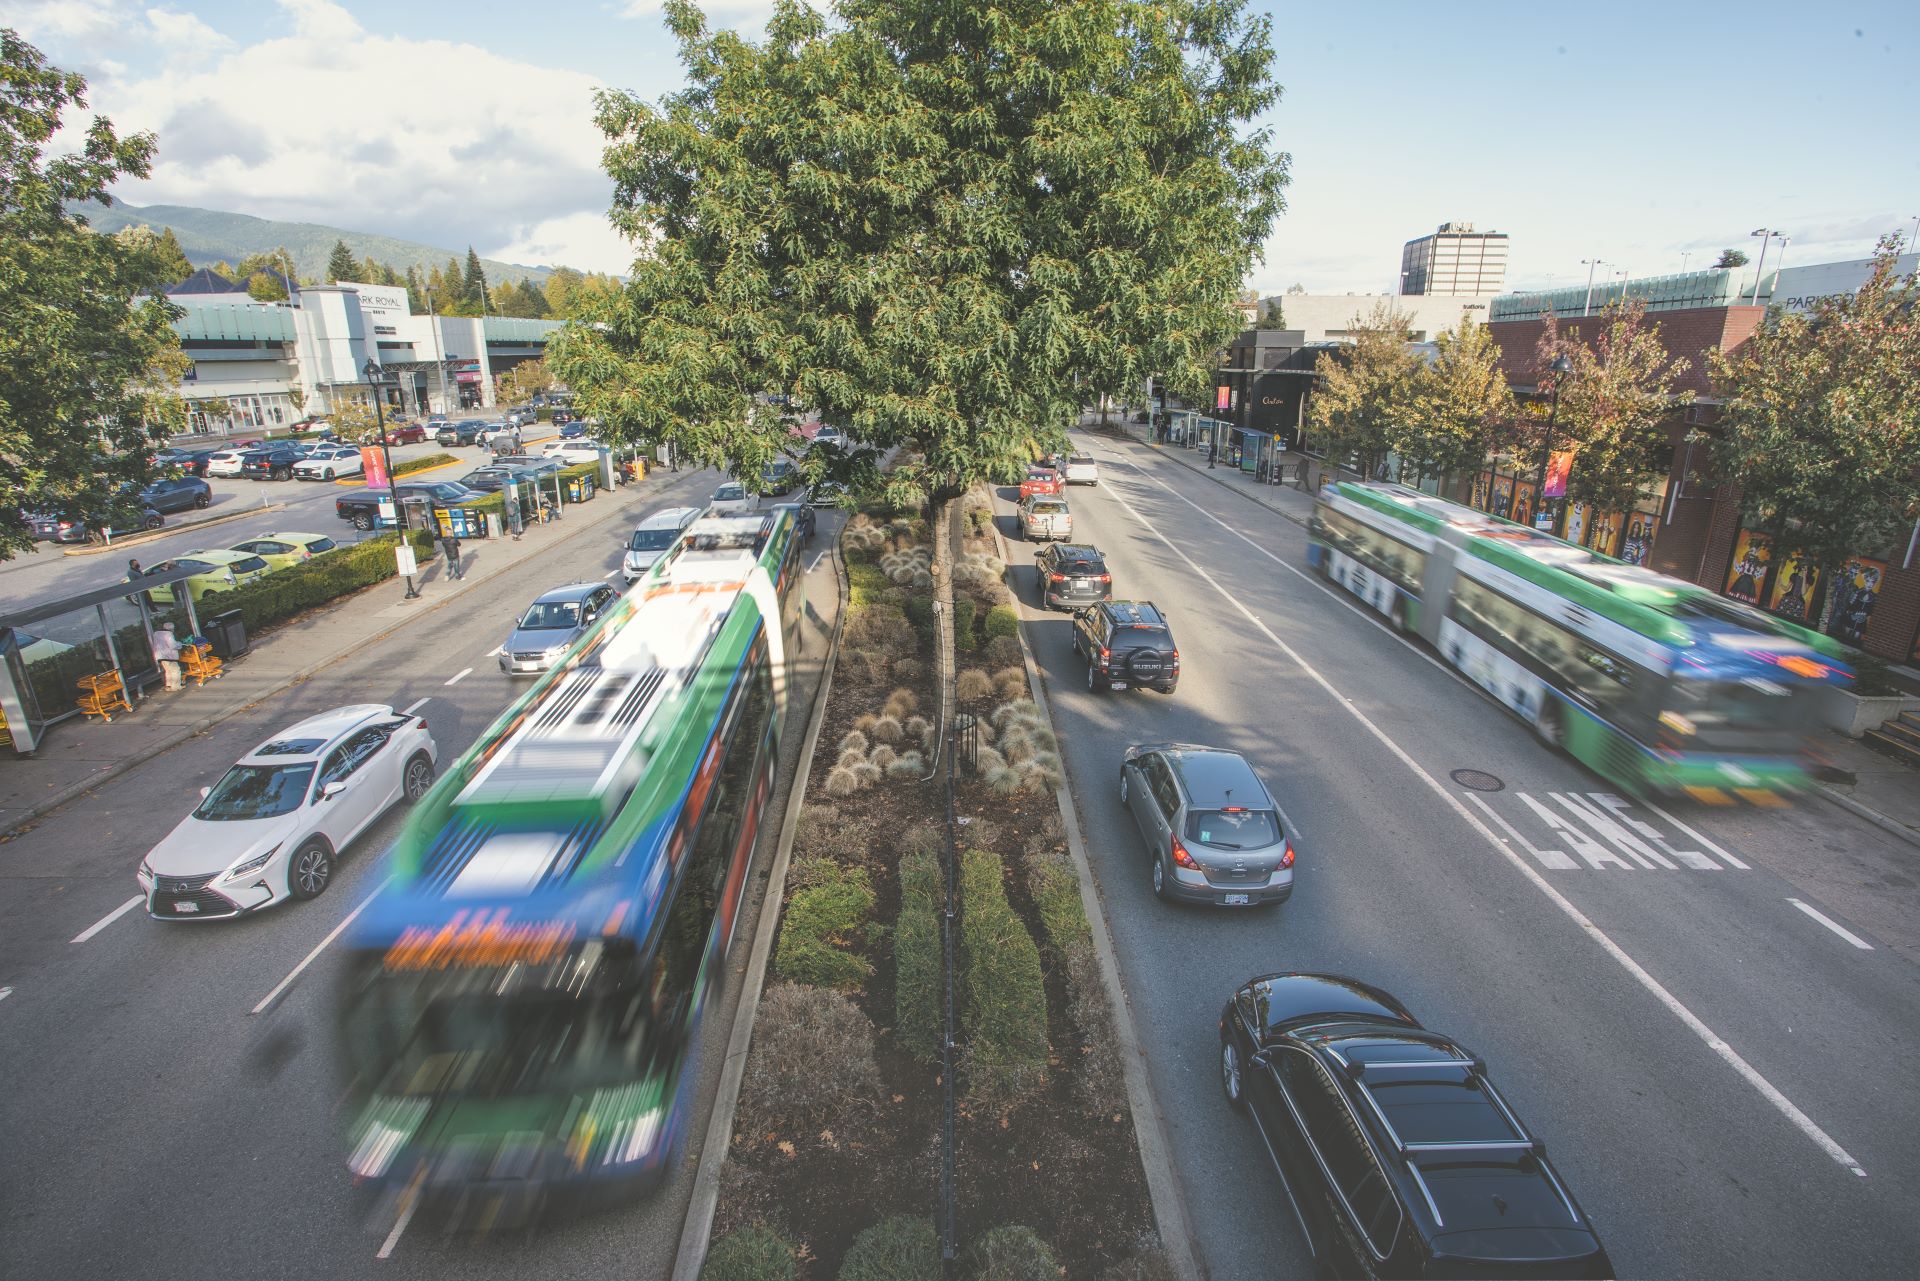
Top 10 bus routes that drove us through the pandemic
Top 10 bus routes that drove us through the pandemic

There’s no denying that these past pandemic years have impacted transit ridership, and Metro Vancouver as a whole, in ways many of us have never seen before.
But despite the challenges the region faced, transit remained an important part of how people moved. During early fall 2020, we continued to serve 621,000 boardings (360,000 journeys) each weekday. While this number is far from the record-breaking ridership numbers we’ve consistently seen in past years, shamelessly, boardings on our system in early fall 2020 still beat that of our larger North American neighbours. Even more shamelessly – our monthly pandemic boardings were higher than metro Portland’s pre-pandemic monthly boardings. Sorry Portland.
We’ve compiled a list of the Top 10 busiest bus routes in Metro Vancouver.
- 99 Commercial/UBC (B-Line)
- R4 41st Ave
- 49 Metrotown Stn/Dunbar Loop/UBC
- 319 Scott Rd Stn/Newton Exch/Scottsdale
- 20 Victoria/Downtown
- 25 Brentwood Stn/UBC
- 16 29th Avenue Stn/Arbutus
- 9 Boundary/Commercial-Broadway/Granville/Alma/UBC
- R1 King George Blvd
- 19 Metrotown Stn/Stanley Park
The 2020 Transit Service Performance Review (TSPR) measures ridership, cost, reliability, on-time performance, and crowding across all transit modes. The findings are an important planning tool that help inform upcoming service change requirements and identify other opportunities to improve service for our customers.
This report also provides key information about how customers used the transit network in 2020. This information informed how we adjusted service throughout the year to respond to COVID-related changes in customer transit-use patterns.
Get more information, and read the full report online at https://www.translink.ca/tspr


Again not complete statistics.Ranking of 10 top Bus Routes
Ranking of Bus Routes in Metro Vancouver;
The top 10 routes by TransLink annual boardings for 2019 are;
99, 49,20,25,41,16,319,9,95,3
If you list them by annual boarding per km of route
you get more inner-city bus routes in Vancouver
Burnaby and New Westminister;
99,5/6,20,9,3,8,106,319,2,119.
In Vancouver, it means the two short West End routes 5 and 6 were bumped from No.14 to No.2 which show that
TransLink does not understand how important is transit for the West End.
In Burnaby/NW route 106 was bumped from No. 23 to No. 7.
In their 2020 report, TransLink again did not list the ranking by km of the route only by ridership They gave the following ranking:
https://www.translink.ca/…/2020-transit-service…
99, R4, 49, 319, 20, 25, 16, 9, R1, 19 However I am sure the West End Routes 5/6 are still No.2 per km. This is an example of ” How to Lie with statistics ” Read this book from the 1950s
Hi Nathan, you bring up fair points, we do typically report on a similar metric to the one that you’re proposing and we plan to continue to do that it future TSPRs.
The metric we usually use is “Top 25 Routes by Average Boardings Per Revenue Hour.” It provides a similar function to the metric you’re suggesting by normalizing boardings by route length.
It can be seen on pg 11 of last year’s TSPR (Table D):
https://www.translink.ca/-/media/translink/documents/plans-and-projects/managing-the-transit-network/tspr/tspr_2019_summary_tables.pdf
Both of these metrics (and others that we typically report on) are important for understanding our network and making service planning decisions. Given the stability of the network as illustrated by the trends in the Top 10 routes, the top routes by boardings per revenue hour were also quite stable.