TransLink ridership rebounds to pre-pandemic overcrowding levels
TransLink ridership rebounds to pre-pandemic overcrowding levels

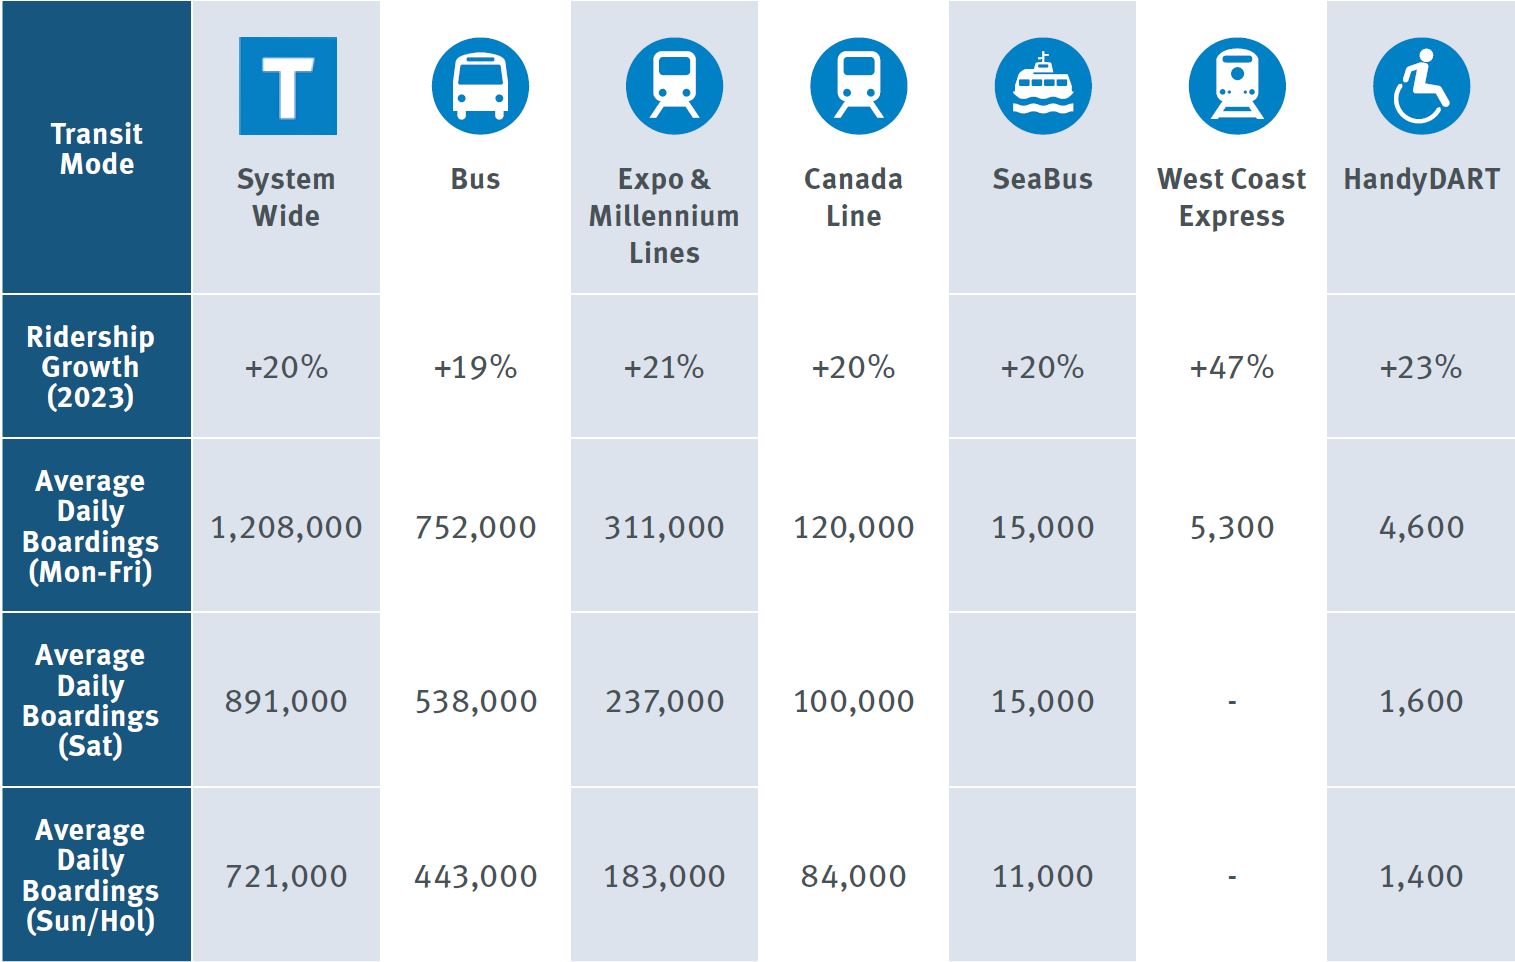
Population growth led to a 20% surge in transit ridership last year
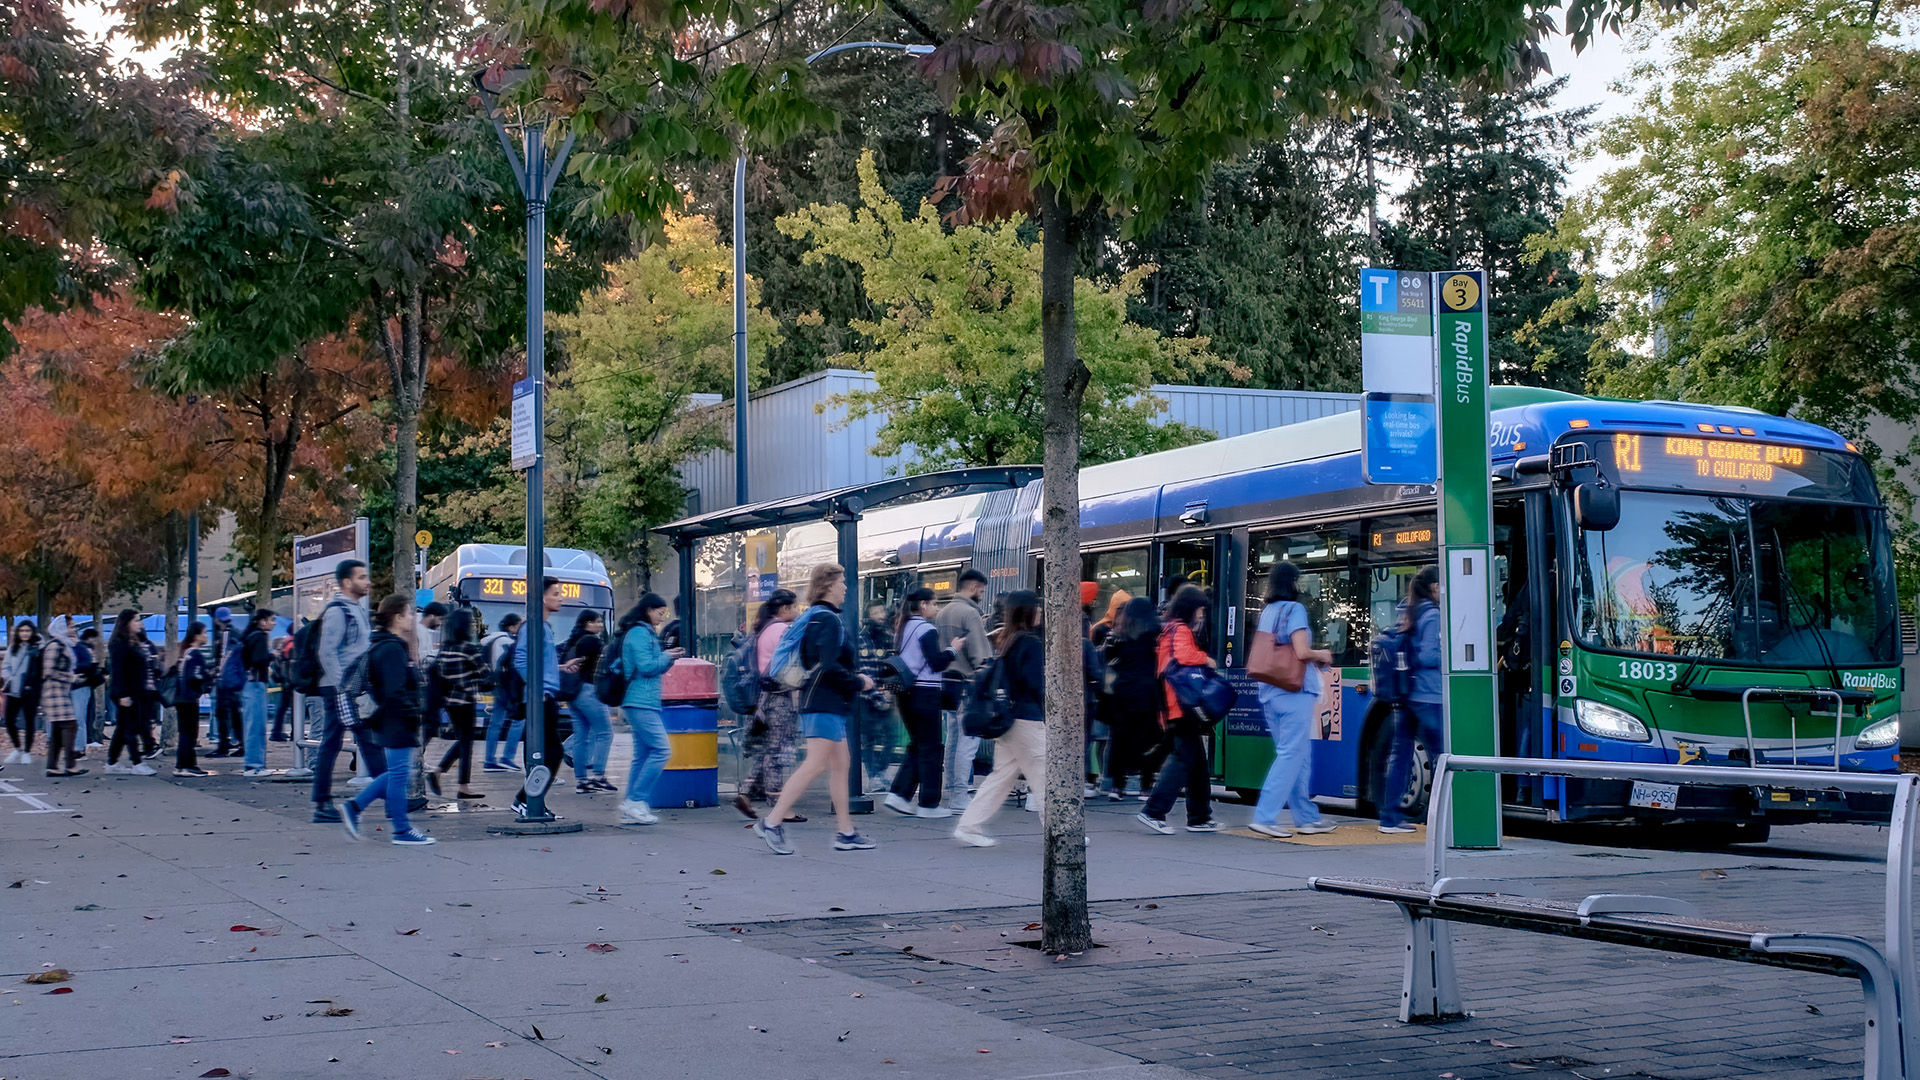
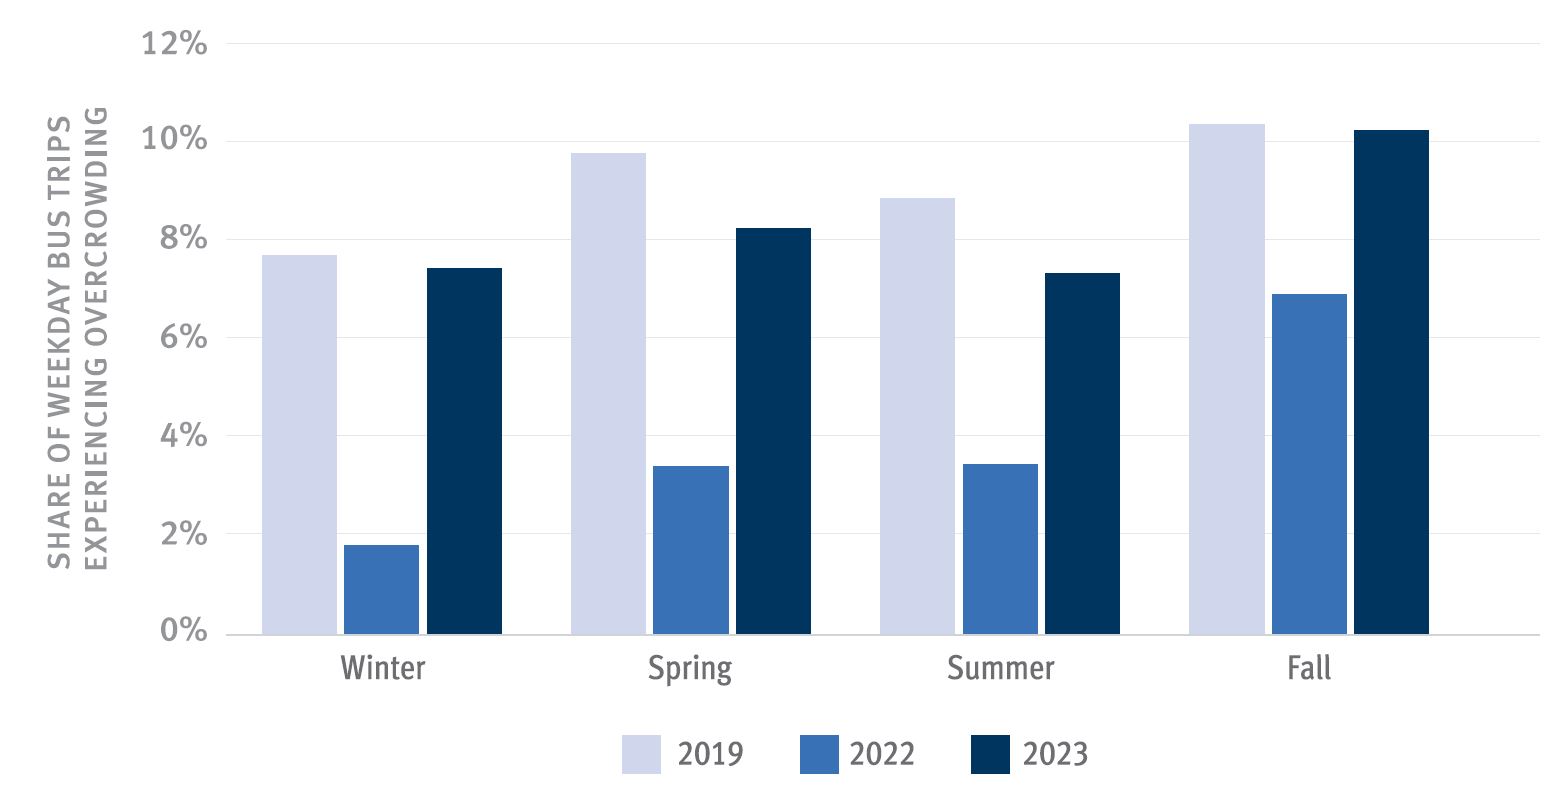
New data from TransLink shows that Metro Vancouver’s strong ridership recovery and population growth has led to unprecedented overcrowding for bus riders, which has now returned to what the region experienced prior to the pandemic.
 This data is part of the newly released 2023 Transit Service Performance Review (TSPR) which details last year’s ridership trends across Metro Vancouver.
“Metro Vancouver’s population is growing rapidly, and so is crowding on our buses,” says TransLink CEO Kevin Quinn. “The 2024 Investment Plan will provide important short-term relief for customers, but we need commitments for long-term support that will help us keep up with population growth.”
TransLink is addressing overcrowding in the short-term through the recently approved 2024 Investment Plan, which is a stopgap plan to increase bus service on the 60 most overcrowded bus routes, expand bus service hours, increase Canada Line frequencies, enhance late-night HandyDART service, and provide earlier SeaBus sailings.
Longer-term, more investment is needed to address TransLink’s structural funding gap and to progress major transit expansion through the 10-Year Access for Everyone Plan.
2023 systemwide trends:
- The equivalent of one-third of Metro Vancouver’s population used transit at least once per week to move around the region.
- Annual journeys across the system totalled 233.24 million in 2023, a 20.5 per cent increase over 2022.
- In fall 2023, TransLink served 430,000 different customers on an average weekday, and approximately 900,000 different customers per week.
Sub-regional trends
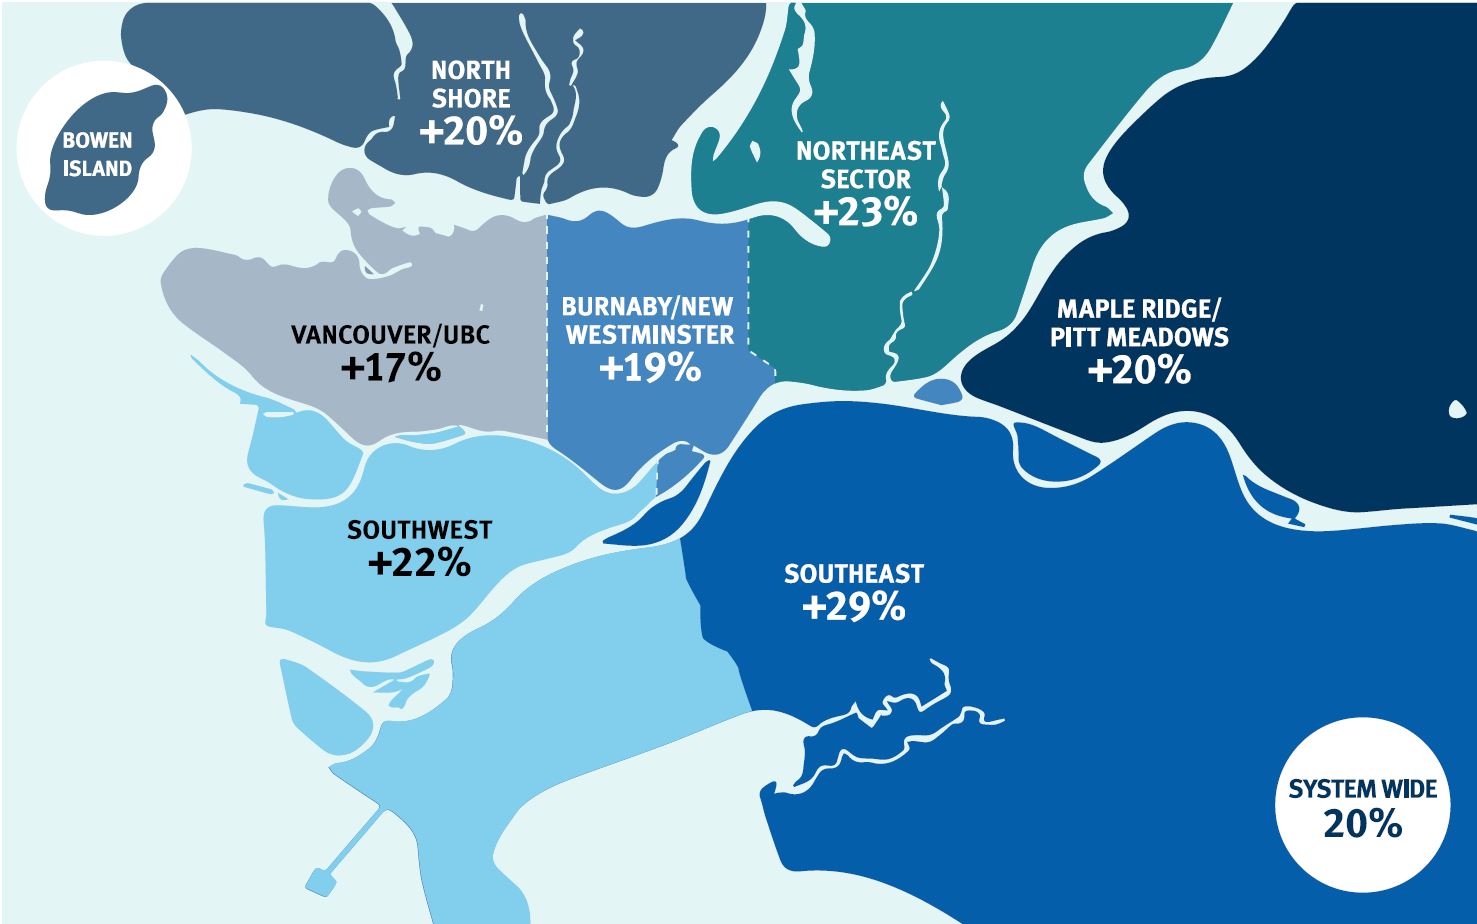
TransLink ridership grew by 20 per cent in 2023, which varied based on sub-region. The sub-region with the strongest growth was the Southeast sub-region, which includes Delta, Langley City, Langley Township, Surrey, and White Rock.
Ridership growth by Sub-Region, Fall 2023 compared to Fall 2022
- Southeast +29%
- Northeast Sector +23%
- Southwest +22%
- North Shore +20%
- Maple Ridge/Pitt Meadows +20%
- Burnaby/New Westminster +19%
- Vancouver/UBC +17%
- System wide +20%
HandyDART trends
TransLink is also releasing a separate deep dive into 2023 HandyDART service through the annual HandyDART Service Performance Review. Some key findings include:
- In 2023, 1,176,000 HandyDART trips were delivered, up 22 per cent from 2022.
- HandyDART customers continued using the service for critical services like dialysis treatments (14 per cent of trips), day programs (35 per cent of trips), or other medical appointments (16 per cent of trips).
- 99.6 per cent of trips requested by HandyDART customers were delivered in 2023.
- HandyDART’s on-time performance continued to be strong, with 91 per cent of all trips arriving on-time.


