
4 key findings from TransLink’s Bus Speed and Reliability Report
4 key findings from TransLink’s Bus Speed and Reliability Report
Did you know we actively adapt our bus network to serve Metro Vancouver better? We do many things to improve our bus services across the region. The Bus Speed and Reliability Report just one of the many tools we use to inform this work. In this report, we deep dive into the cause of our delays from both the passenger and operation sides. Let’s recap the key findings from the report:
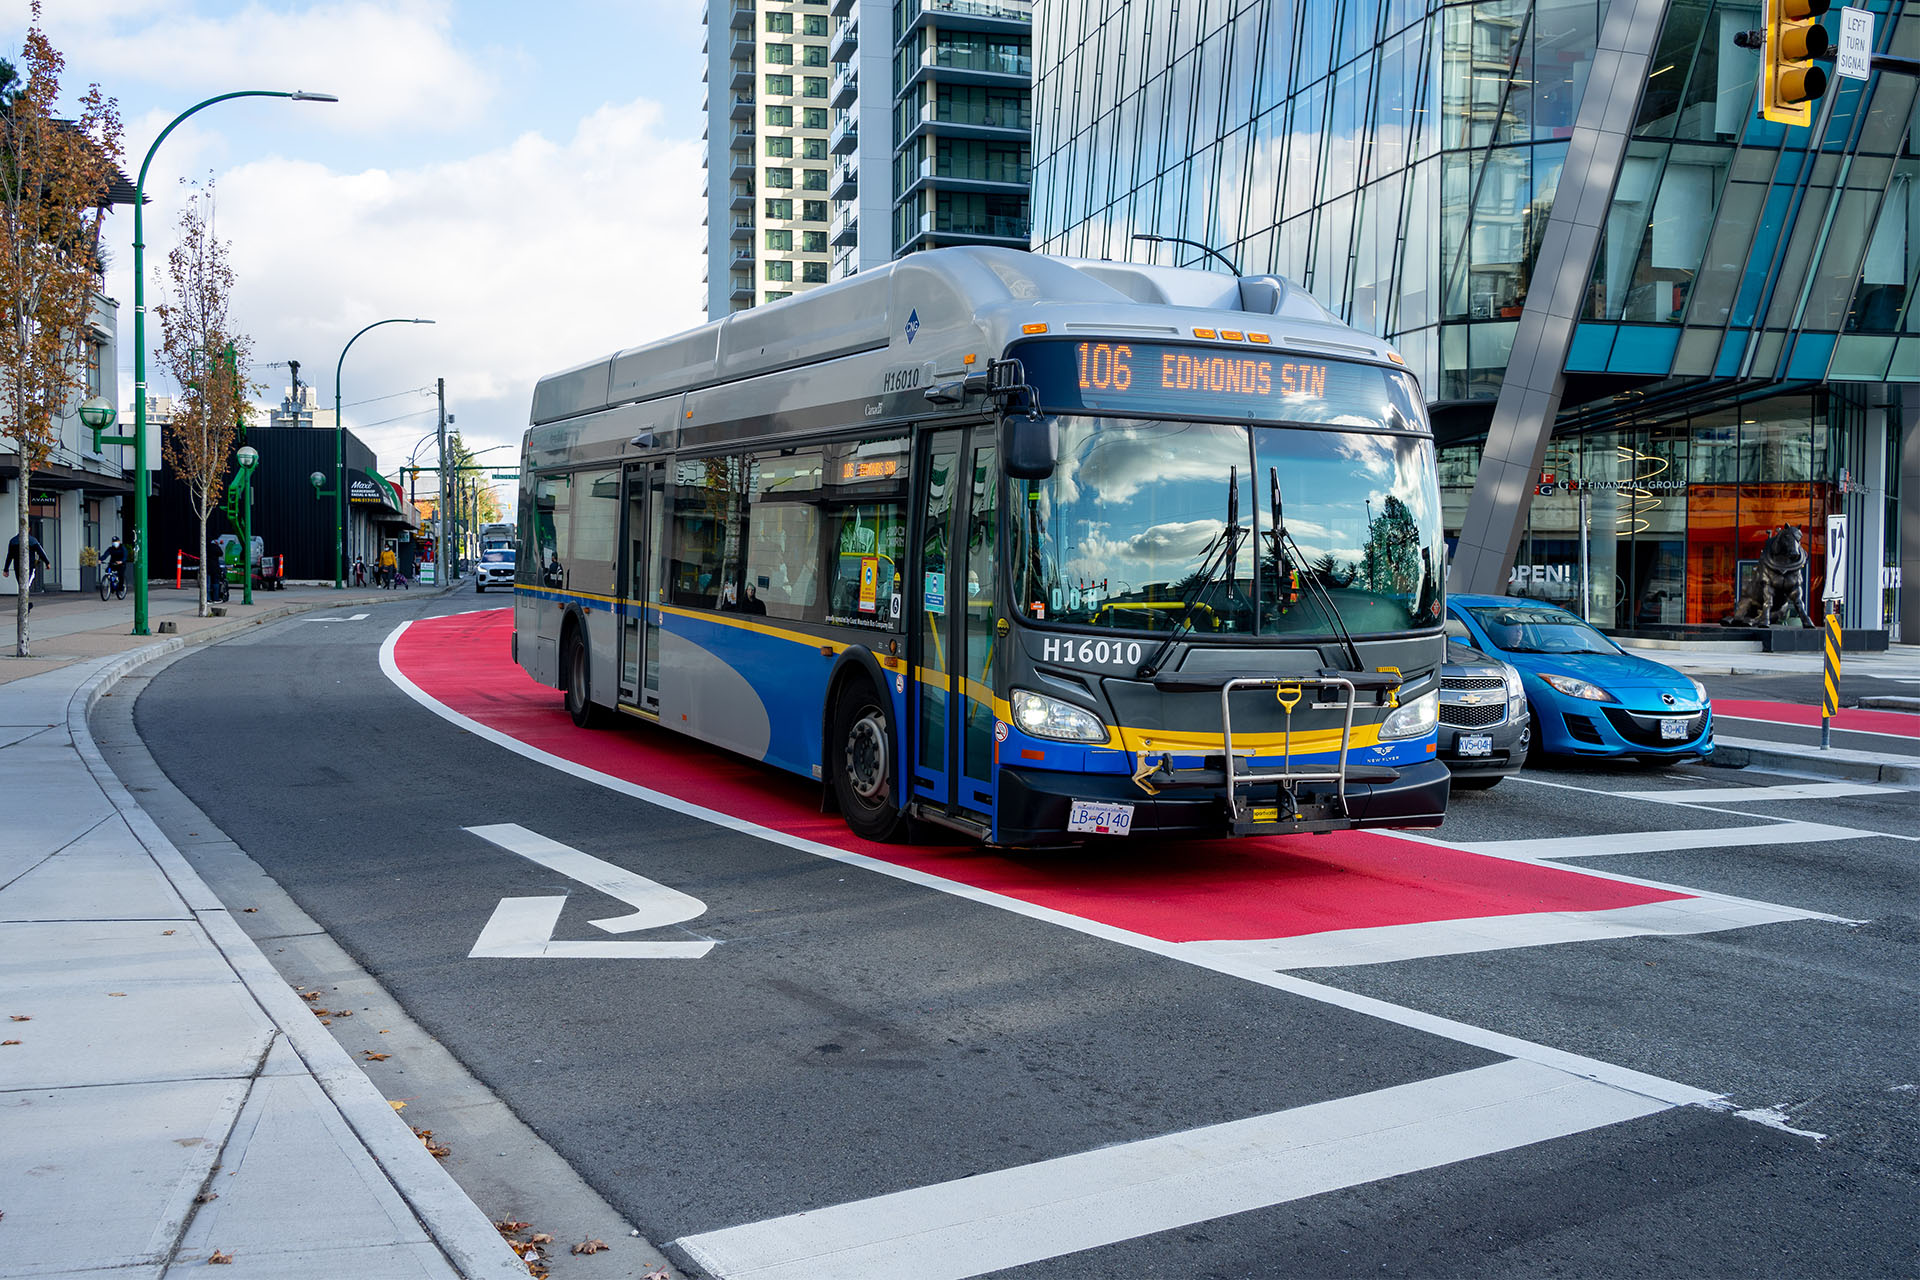
Less traffic means faster buses
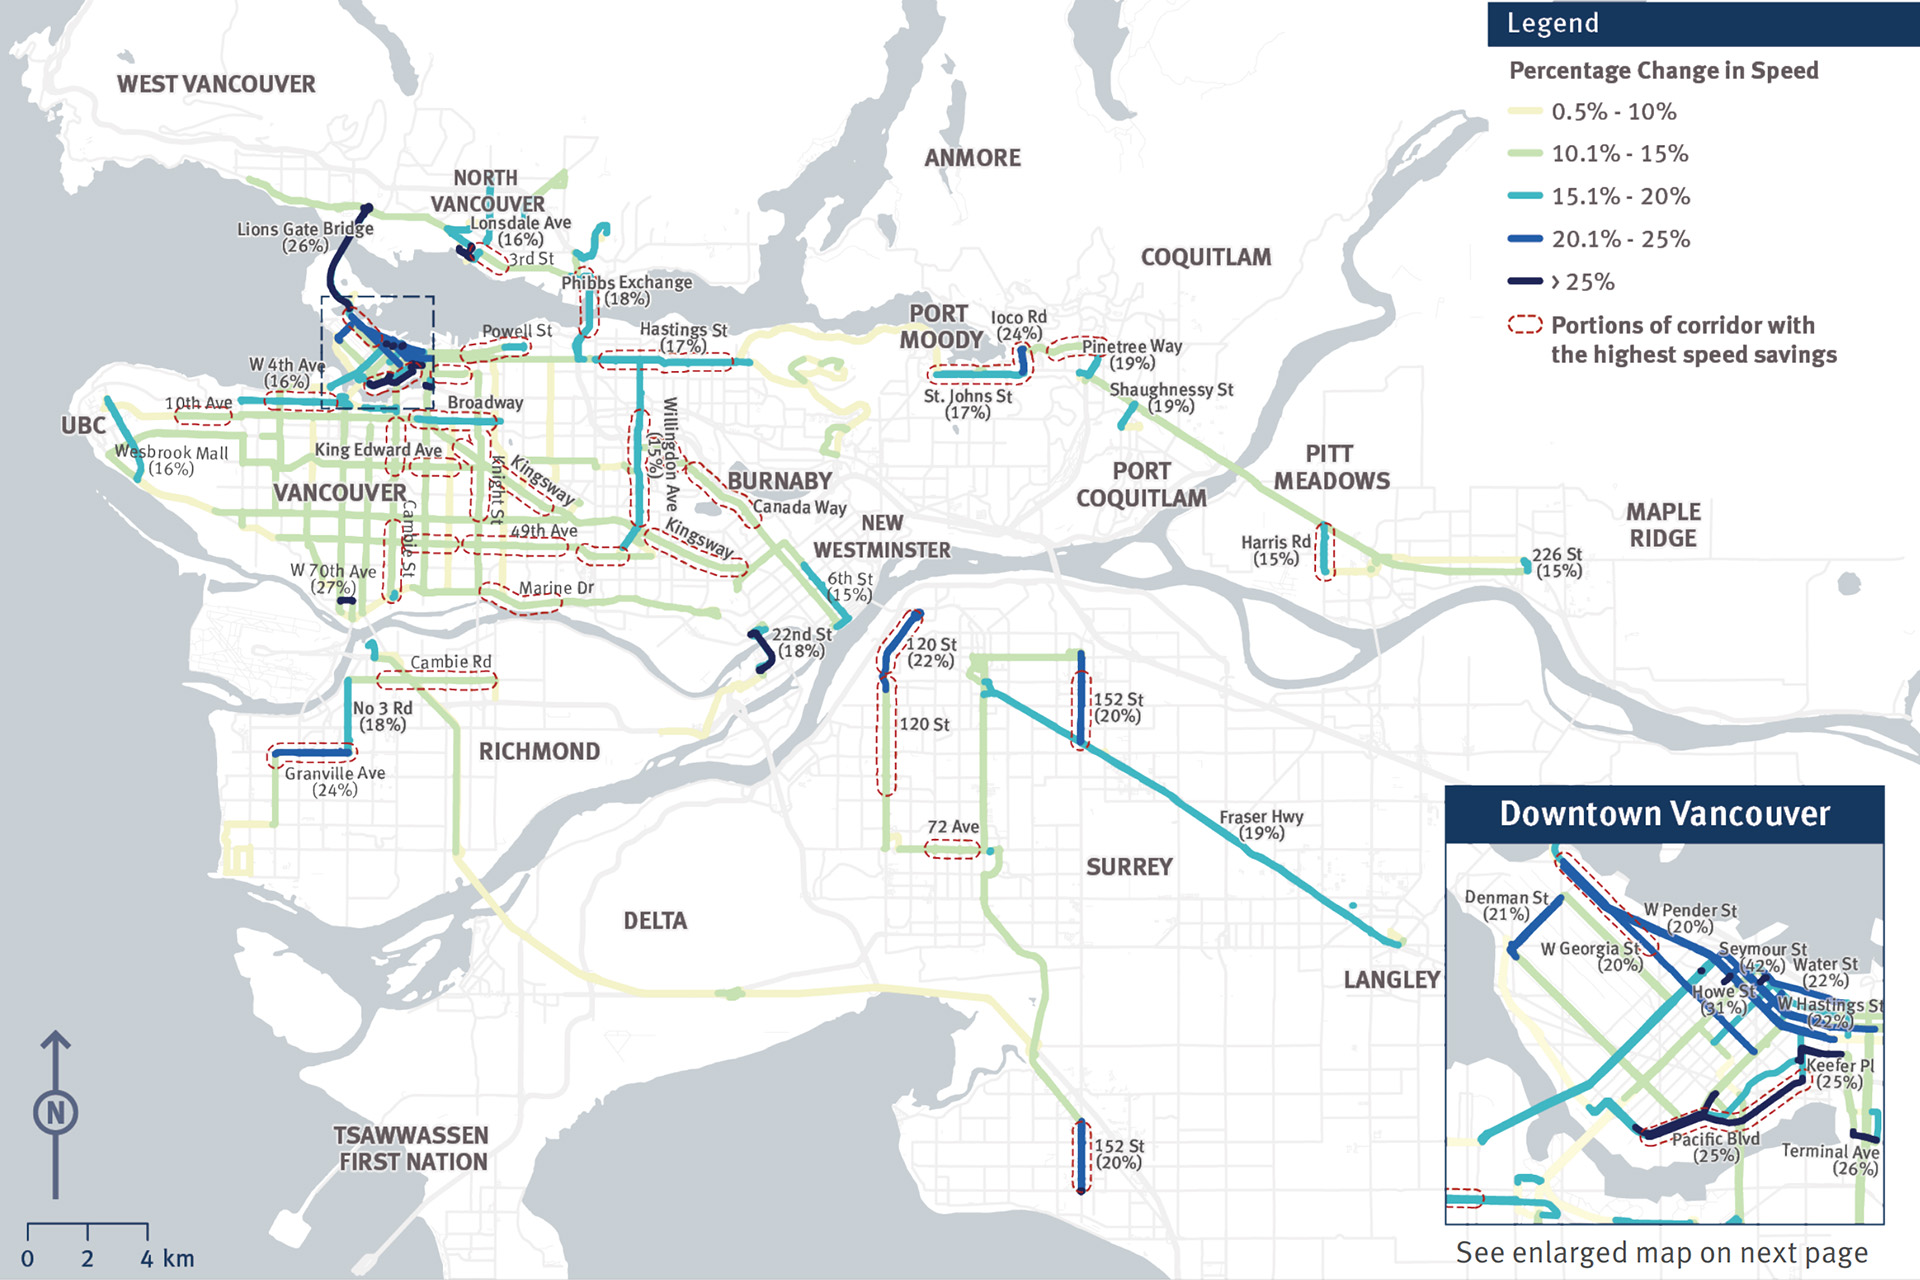
The pandemic was a great real-life example of how less congestion allows faster and more efficient bus services. Comparing February 2020 to April 2020 (when pandemic restrictions came into effect), we saw less traffic, resulting in a 14 per cent system-wide speed improvement. This effect was most evident in some of our most travelled corridors where we saw speed improvements of up to 25 per cent.
However, as traffic ramped back to pre-pandemic levels, so too has the road congestion. By September 2021, buses were spending about 15 per cent of their service hours slowed by traffic, costing TransLink about $80 million per year.
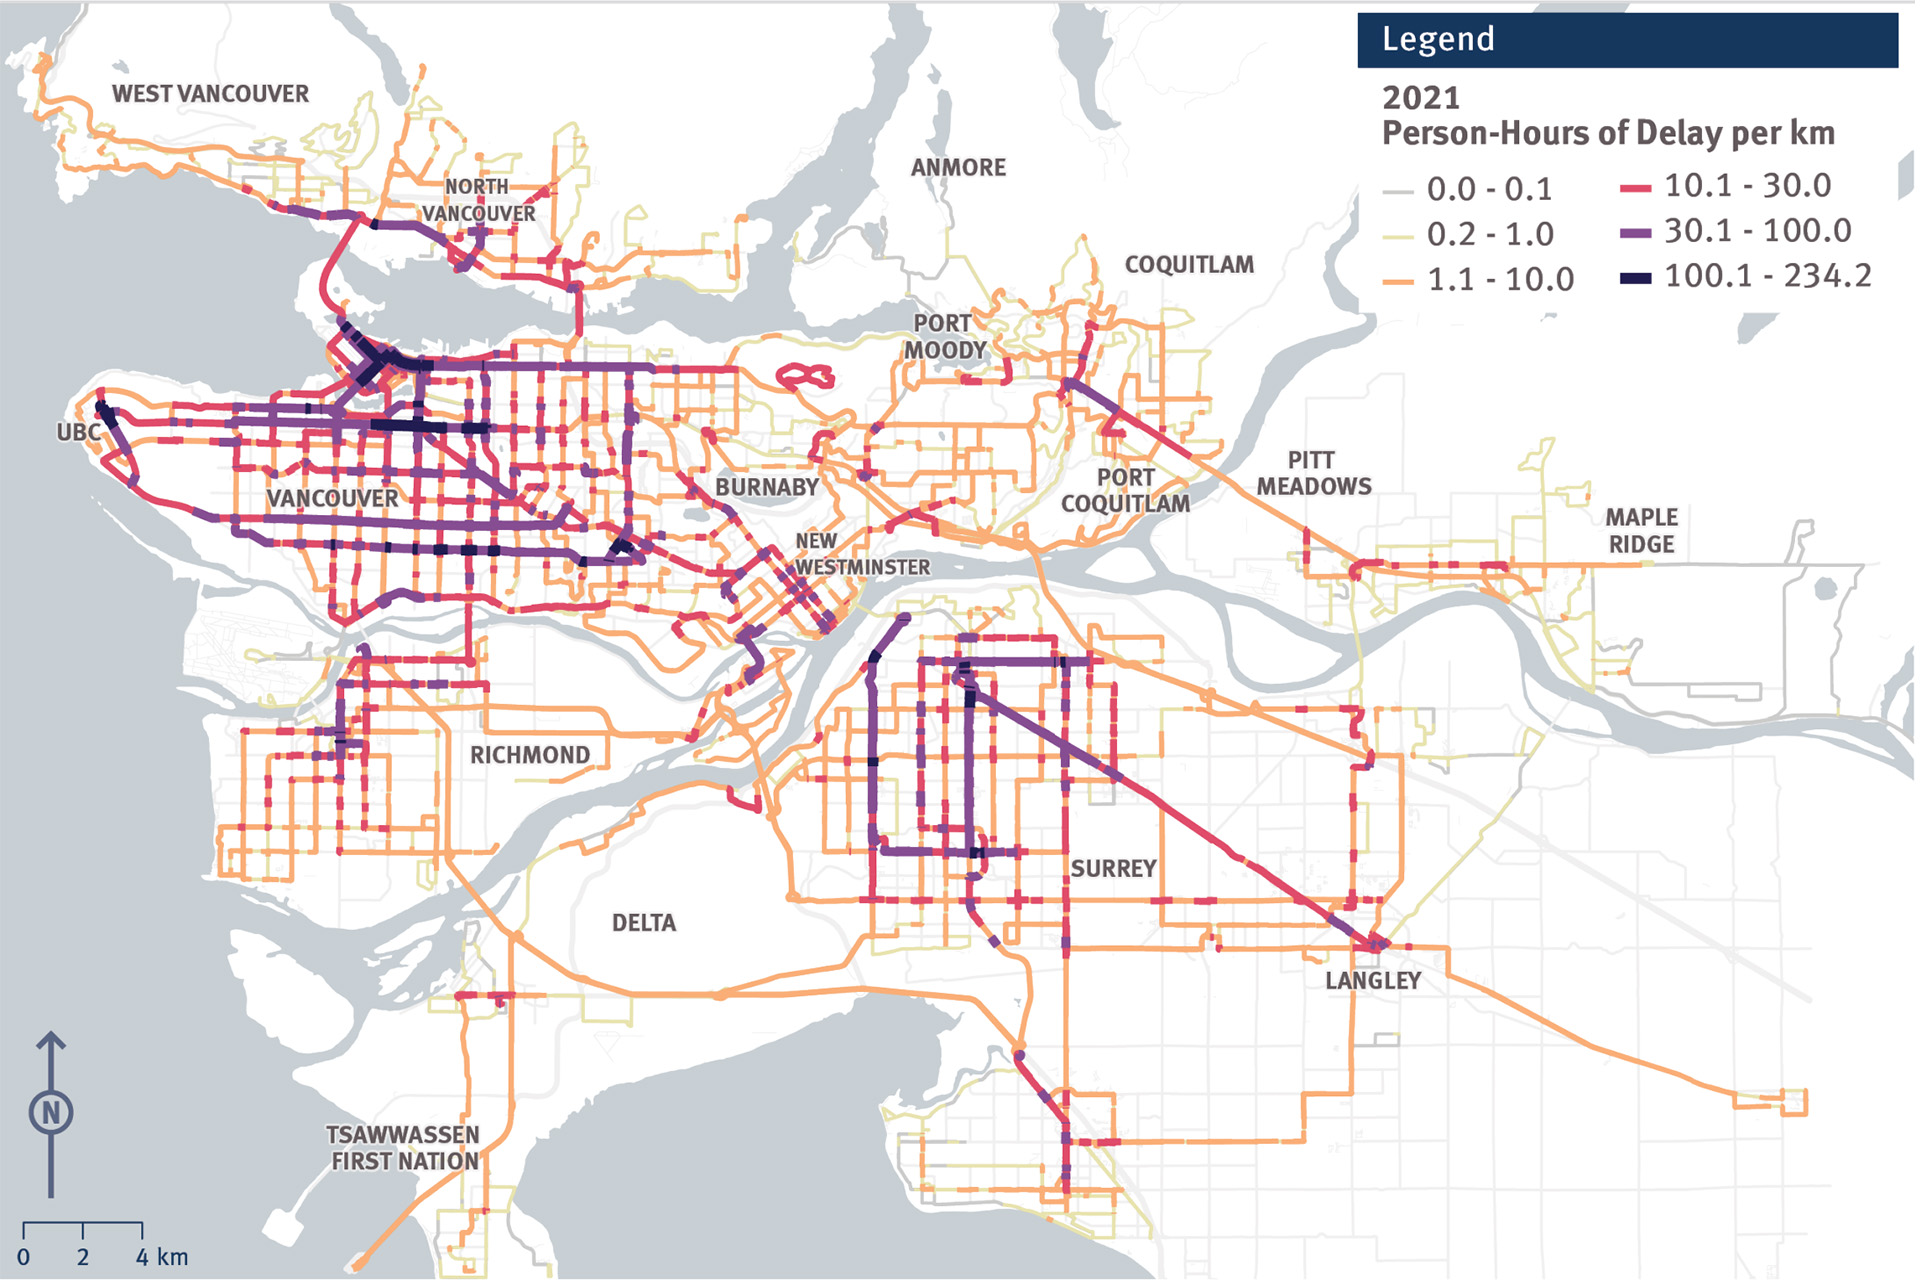
Delays are concentrated on key corridors
Although delays occur across the region, there are some particularly congested corridors — especially if you look at the impact on our customers. By multiplying the number of hours a bus is delayed by the number of passengers on that bus, we calculate the “person-hours” of delay. Over 40 per cent of these lost person-hours are concentrated on less than 10 per cent of the network. This suggests that strategic investment in bus priority measures can address much of the delay our customers experience.
Buses carry many of the people on the road
Data shows that 30-60 per cent of travellers along our busiest corridors during the busiest times of day ride the bus. These are also places where they experience some of the greatest delays. These locations are where there is a strong case for TransLink and our partners to investigate bus priority measures, such as those funded by TransLink’s Bus Speed & Reliability Program.
How we use our roads can shape the region
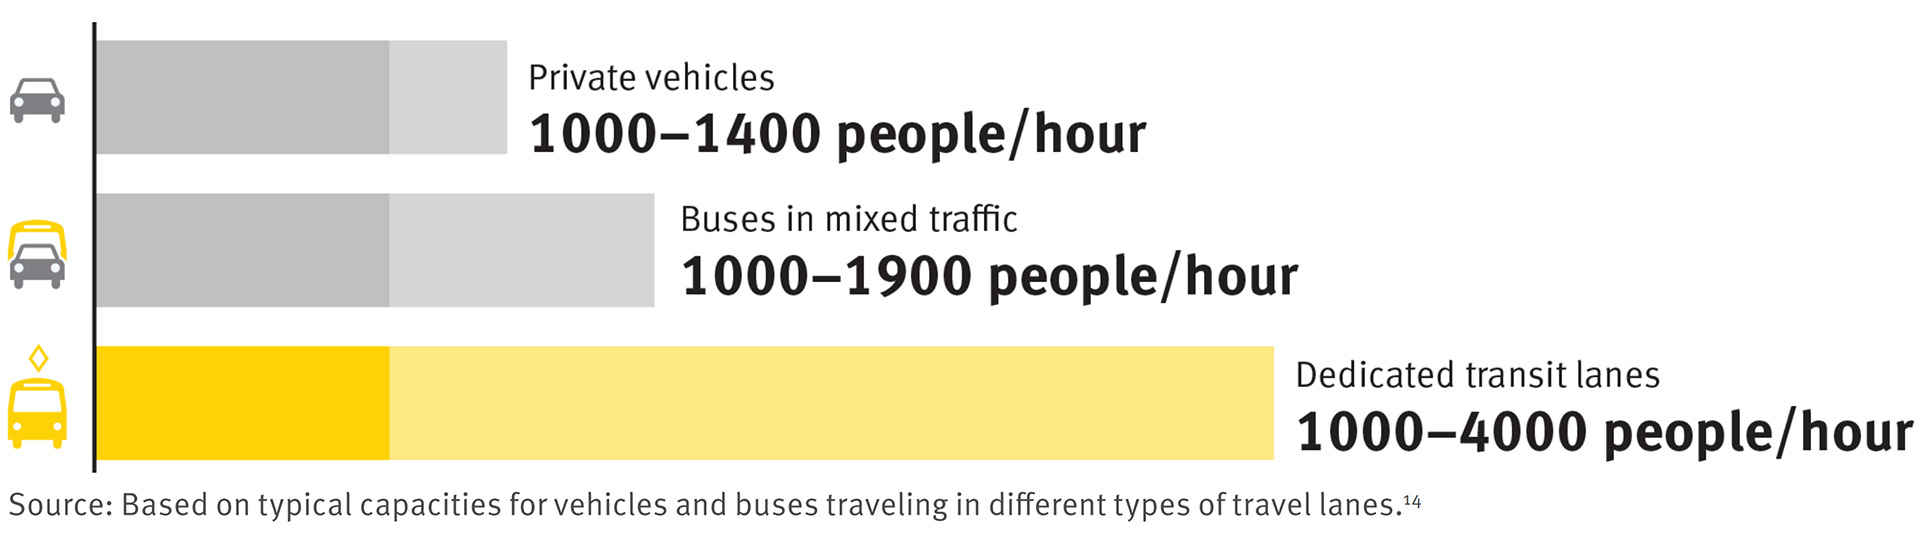
Roads are a finite resource, so we need to make sure we’re making the best use of this infrastructure. Buses are a more cost-effective and efficient way of moving people across the region compared a private vehicle, and here’s why:
- Less need to build additional infrastructure (buses can carry much more on a specific corridor than a vehicle can — less need for road expansion projects!)
- Private vehicles carry far less than a bus, yet more cars are on the road — an inefficient use of space!
- Up to four times the amount of people can move per hour in a bus-only priority lane than in regular traffic.
The impact is clear. Traffic causes delays to our buses, which is costly and delays our customers. Our key corridors with many bus customers are most impacted, and we can use our road more efficiently by prioritizing the bus.
For more information about the Bus Speed and Reliability Report, read Part 1 of the report. A further addition of the report is to come later in 2023, with information about what TransLink and our municipal partners have done and can do to address this challenge.
And the sky is blue, ice is cold and ???
Bus improvements can also protect the environment as the number of private vehicles is reduced.