
5 things about how you rode transit in 2021
5 things about how you rode transit in 2021
In fall 2021, nearly 2.2 million individuals rode the transit system, which is equivalent to about 84 per cent of Metro Vancouver’s population.
That’s one of the many things we learned through the Transit Service Performance Review (TSPR) and HandyDART Service Performance (HDSPR). They are our annual “report cards” on ridership and transit services.
The reports provide key information on how customers used the transit network and how we adapted service in the previous year. We use the information included in these reports to inform network adjustments that ensure our transit services best meet customers’ needs.
Transit agencies around the world are grappling with ridership recovery, which is a measurement of the percentage of ridership that has returned in relation to levels prior to the COVID-19 pandemic. Analyzing this allows us to gauge the extent to which people in the region have returned to pre-pandemic travel patterns and identify any new travel patterns emerging.
It’s invaluable information that informs our quarterly Transit Service Changes and delivery of the 10-Year Priorities.
Here’s what we learned about how chose to ride transit: ?
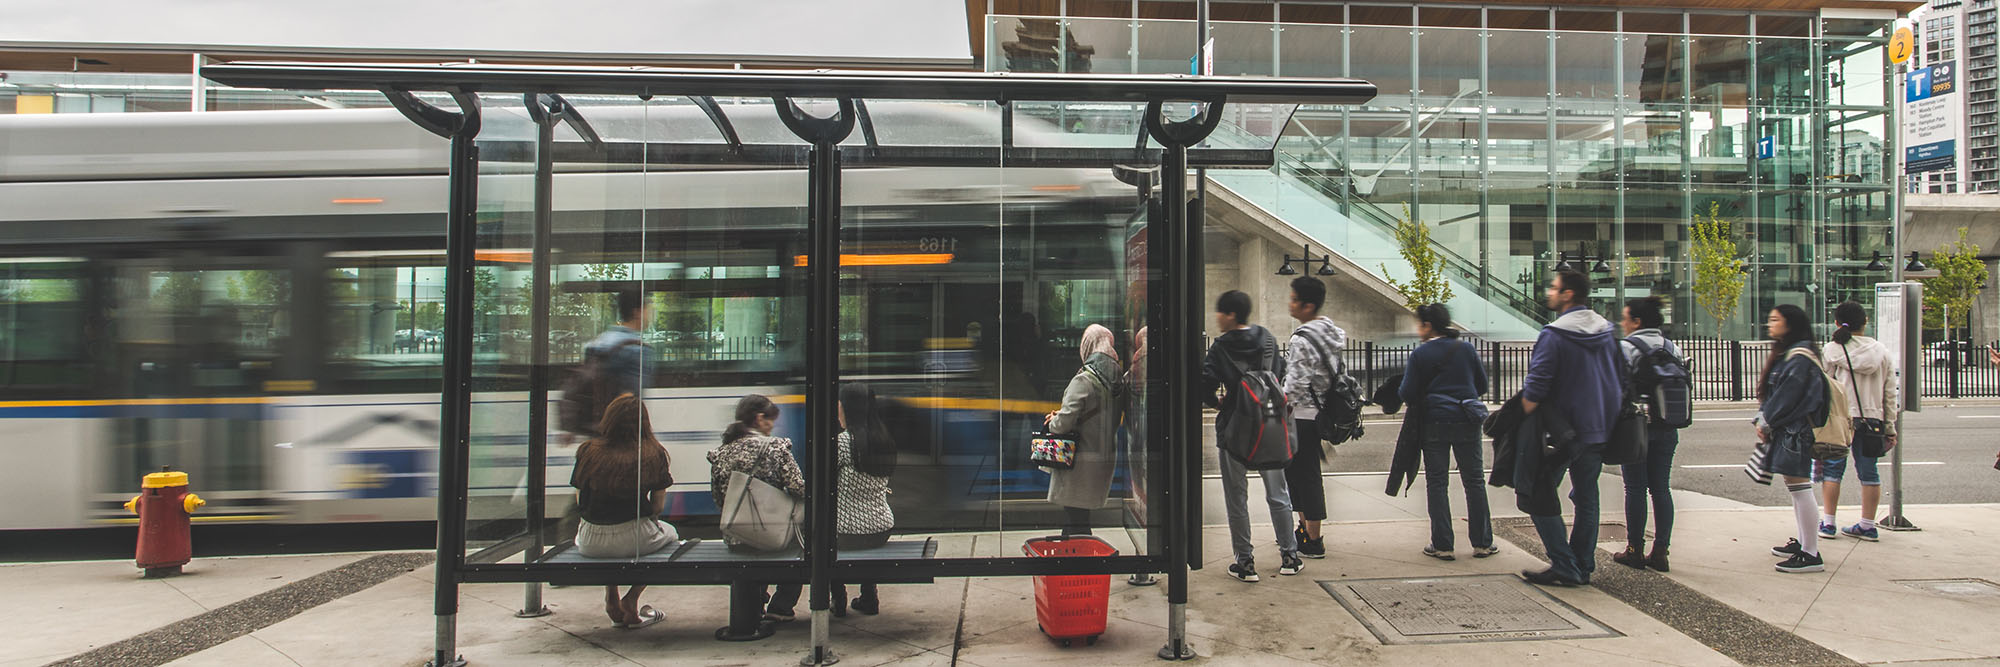
1 | More of you are riding transit again, especially on buses
Bus ridership is recovering faster than all other transit modes. It outpaced HandyDART (59 per cent), SkyTrain’s Expo and Millennium Lines (57 per cent), the Canada Line and SeaBus (both at 54 per cent), and the West Coast Express (26 per cent). Since then, bus ridership recovery has grown to 71 per cent in May 2022.
In the fall of 2021, our system-wide ridership recovery was 59 per cent (of the same time period in 2019), exceeding the average recovery rate across peer transit agencies across North America. This places us ahead of cities such as Montreal, Toronto, Washington, D.C., Chicago, Ottawa, and San Francisco. Since then, system-wide ridership recovery has recovered even further to about 70 per cent, according to our latest numbers.
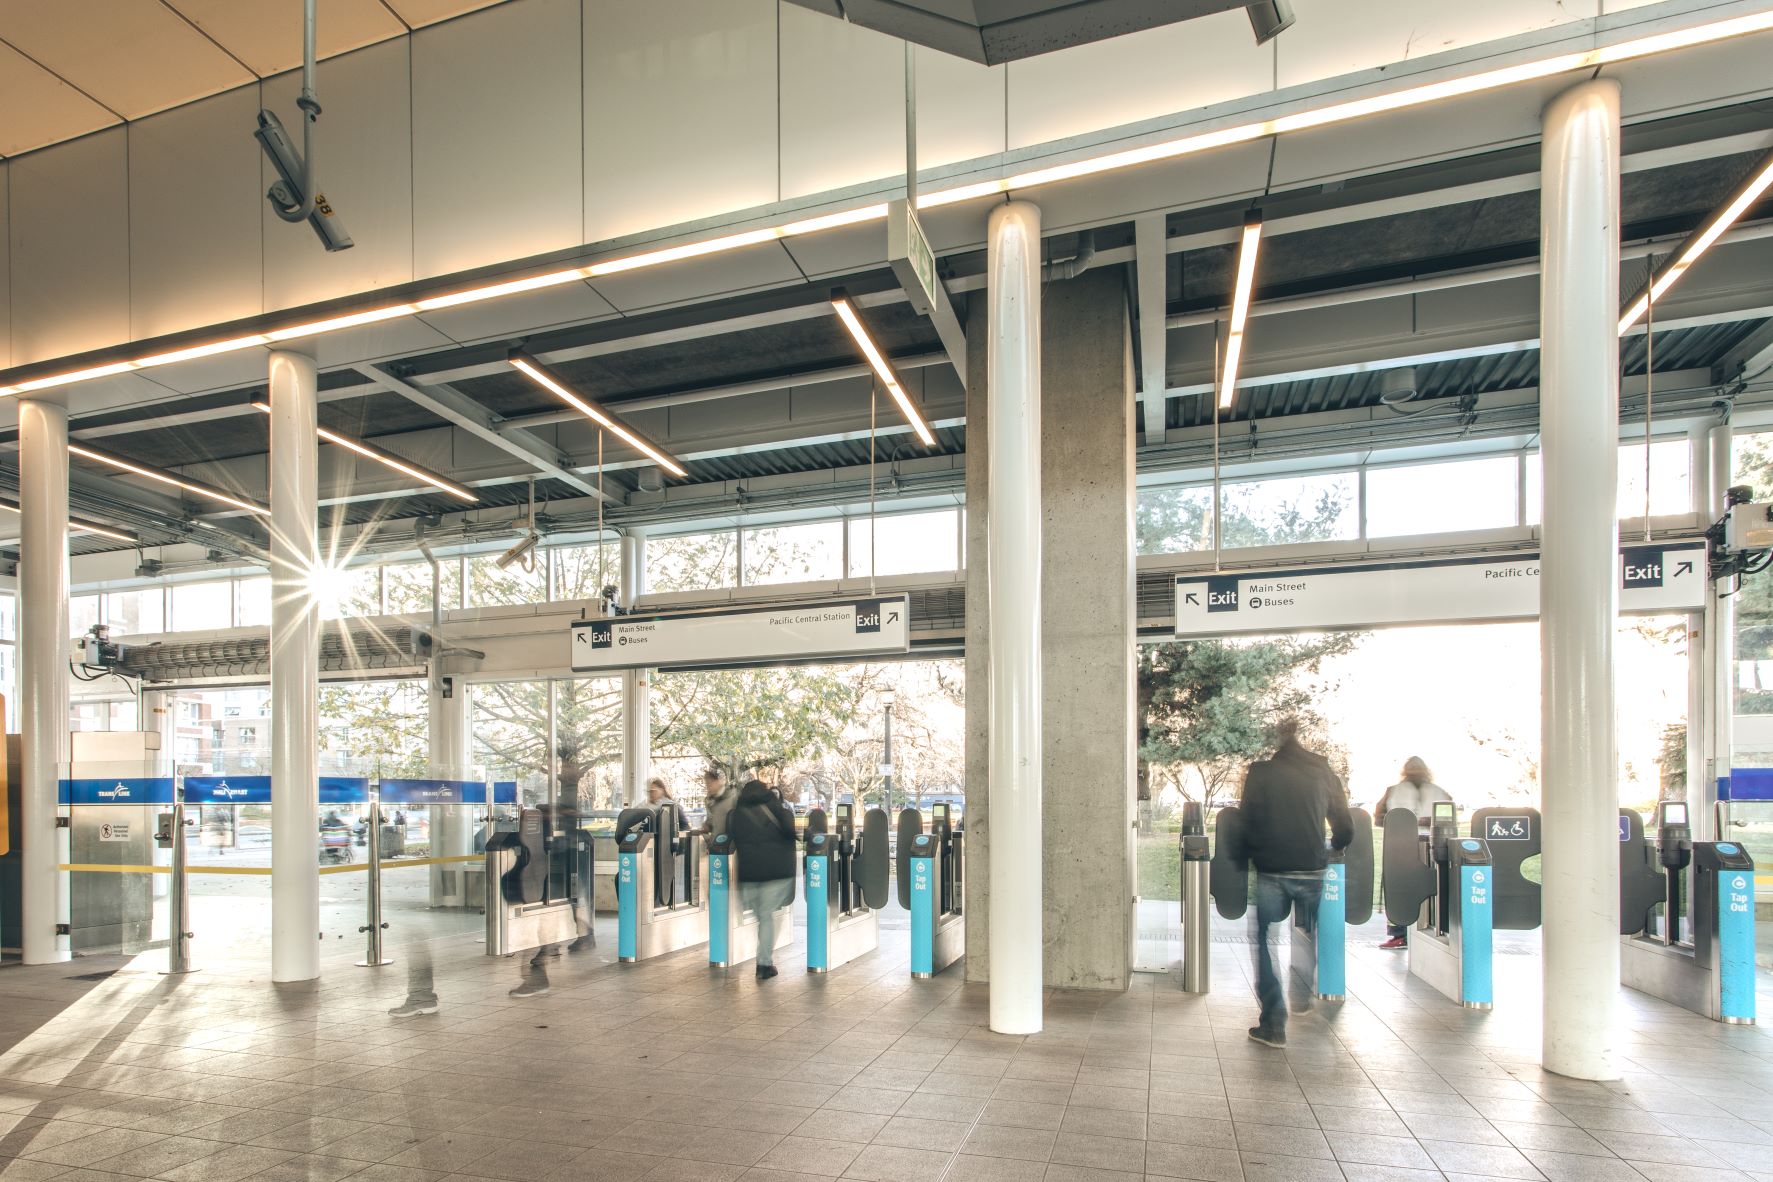
In all of 2021, customers logged 224 million total boardings. This exceeded the boardings of most North American counterparts, including Boston and Atlanta combined.
What’s a boarding? A boarding represents each time a customer boards a bus or taps into a fare gate – any fare-paid zone on the transit system – including transfers.
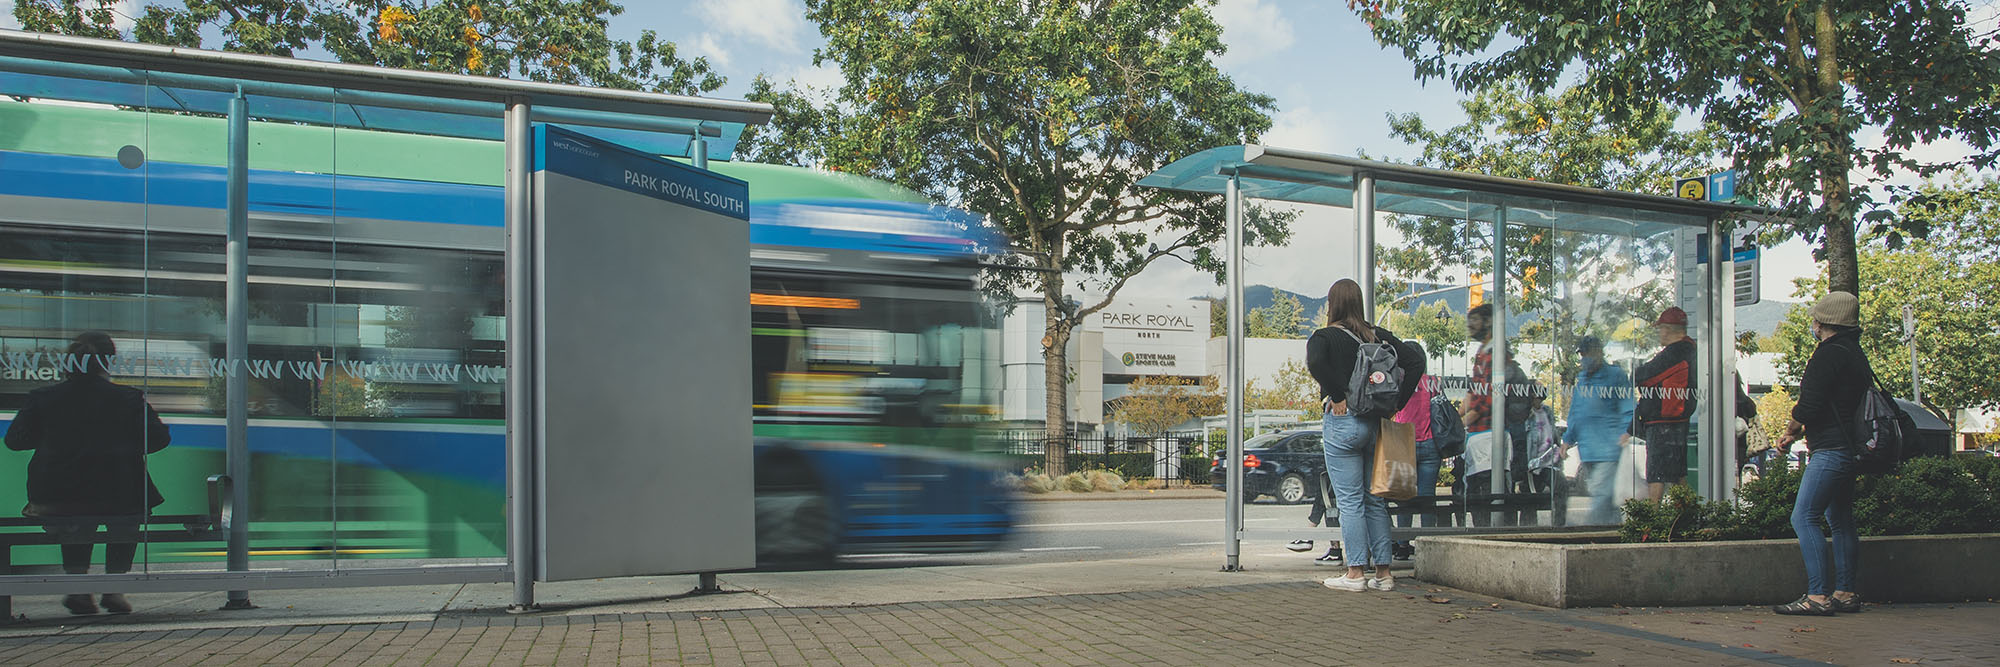
2 | You really like RapidBus
The RapidBus routes are champions of ridership recovery in the areas they serve, seeing some of the highest ridership in the region. All five RapidBus routes are in the top three in their respective sub-regions.
What’s a sub-region? Metro Vancouver is a large region comprised of 23 diverse communities and municipalities. To ensure local context and needs are understood and reflected in transportation planning, TransLink divides Metro Vancouver into sub-regions.
The introduction of the R4 41st Ave RapidBus catapulted Joyce–Collingwood Station from the ninth busiest SkyTrain station in 2019 to sixth in 2021.
The R4, along with the R5 Hastings St RapidBus and R1 King George Blvd RapidBus, cracked the top-10 busiest bus routes — all of which provide frequent services throughout the day.
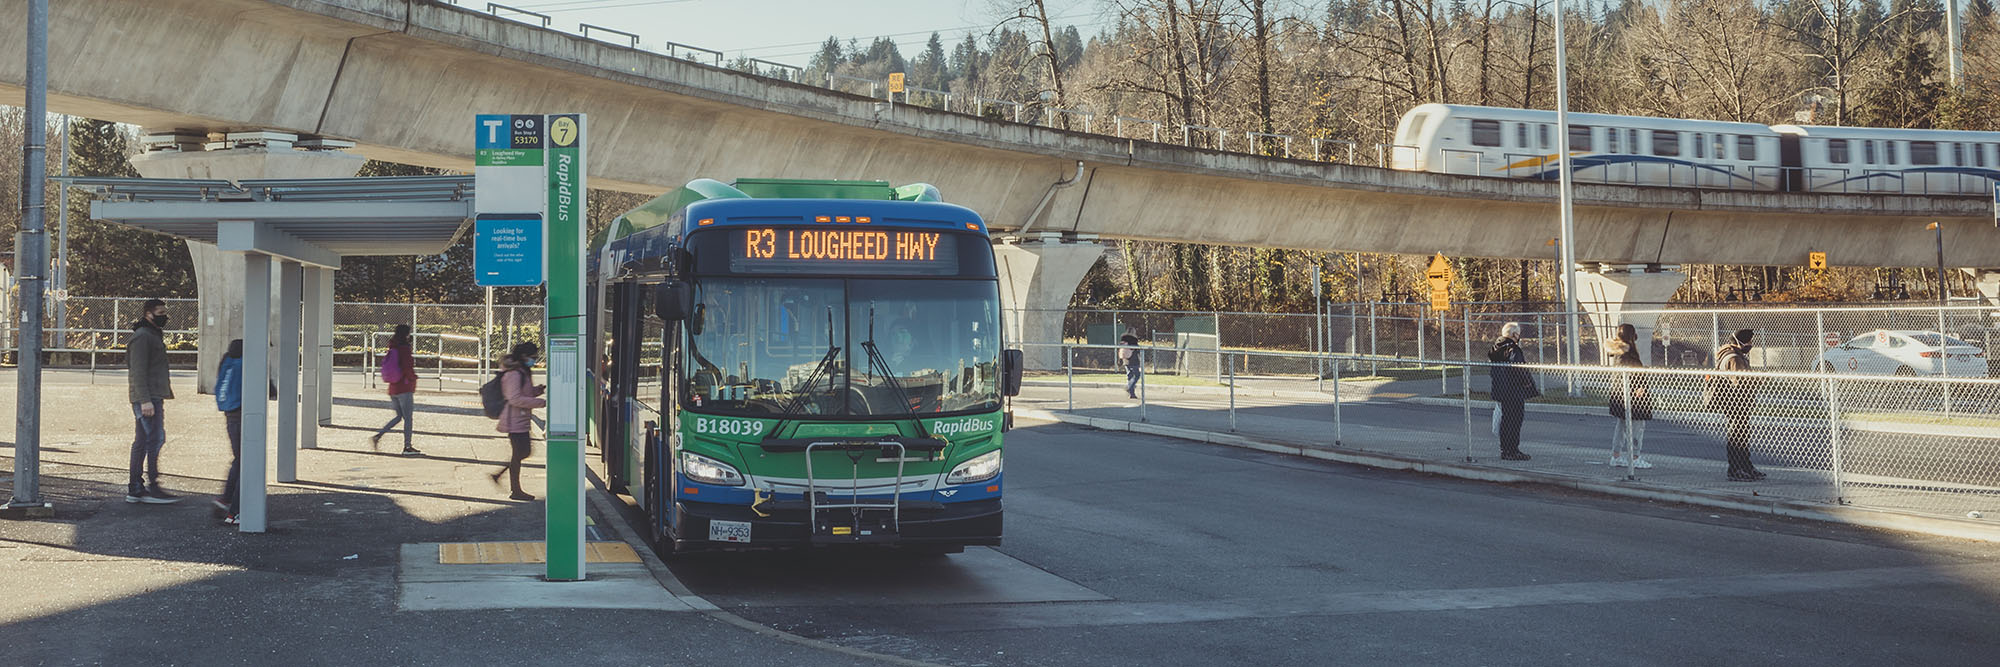
3 | More of you are riding, especially in these three areas
The Southeast and Maple Ridge/Pitt Meadows sub-regions, as well as industrial employment areas all saw high levels of customers returning to transit.
The Southeast sub-region — Surrey, the City of Langley, the Township of Langley, White Rock, and North Delta — led the way with a 75 per cent ridership recovery. Maple Ridge and Pitt Meadows also had high ridership recovery at 74 per cent thanks to the R3 Lougheed Hwy RapidBus that has generated new ridership in this area.
In response to faster ridership recovery and overcrowding on some bus routes in the Southeast, we reallocated service from routes in other sub-regions with lower demand in order to increase service on routes such as the 319 Scott Road Stn/Newton Exchange, which is a future RapidBus corridor, and 531 White Rock/Willowbrook.
Bus service in the Southeast sub-region was increased by 8 per cent as ridership recovered faster than most other sub-regions. We also increased service on other modes such as SeaBus during times of day with higher levels of demand.
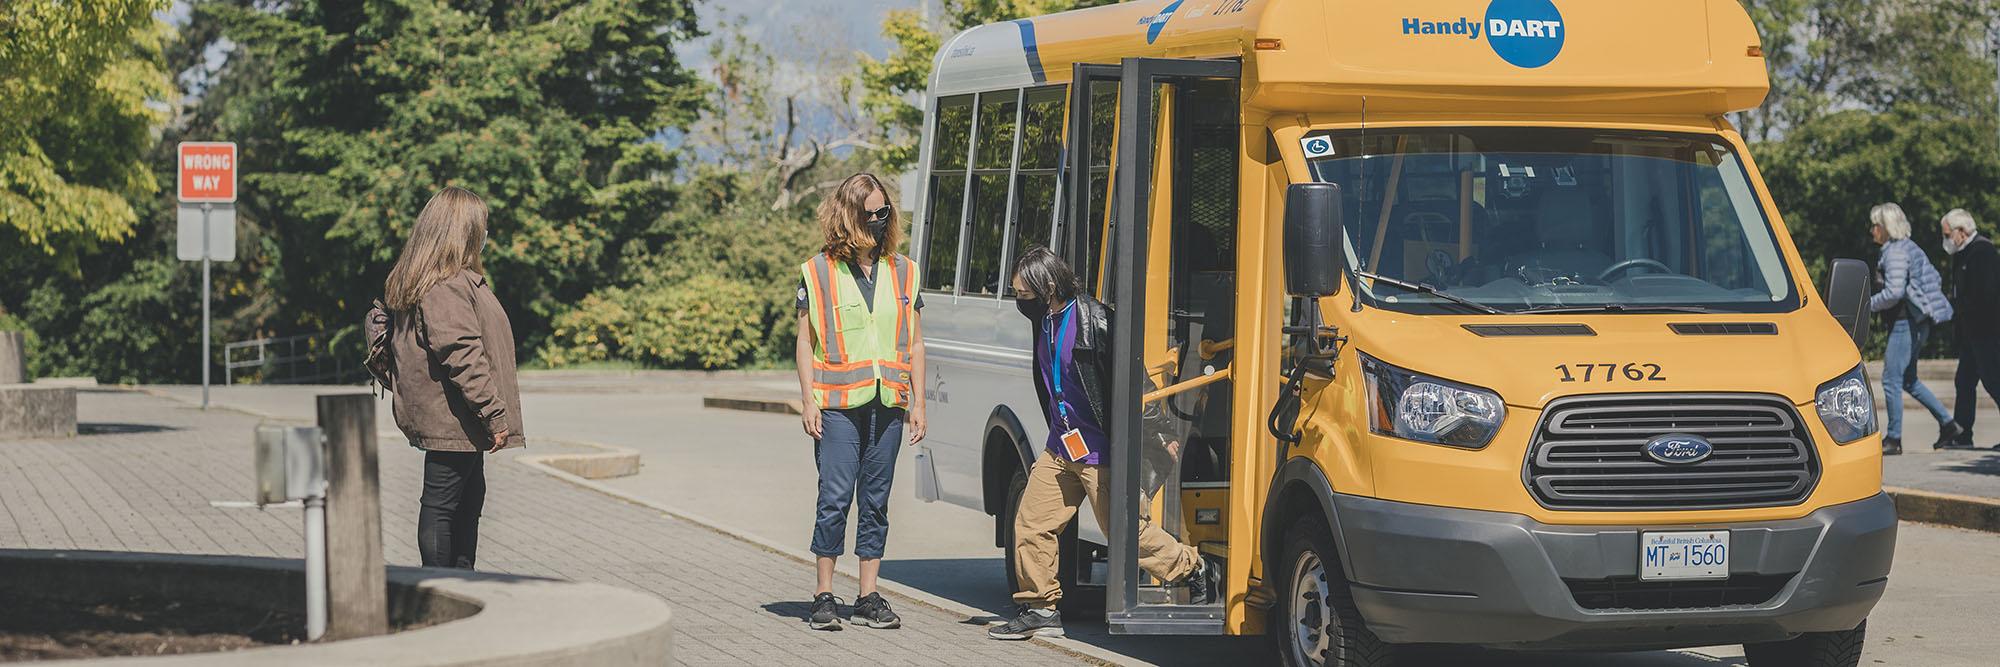
4 | HandyDART continues to provide critical trips
HandyDART continued to provide a reliable service to customers who needed it and demand grew as public health restrictions eased and vaccination rates increased.
Ninety-four per cent of HandyDART trips were delivered early or on time and essential trips for kidney dialysis and medical appointments made up half of all HandyDART trips.
Customer experience on HandyDART was improved with the integration of Compass. HandyDART customers now benefit from age-based discounts and contactless payment through Compass Cards and Tap to Pay. These improvements were a result of the HandyDART Modernization Program and made HandyDART more equitable with the conventional transit system while simplifying use and payment through Compass.
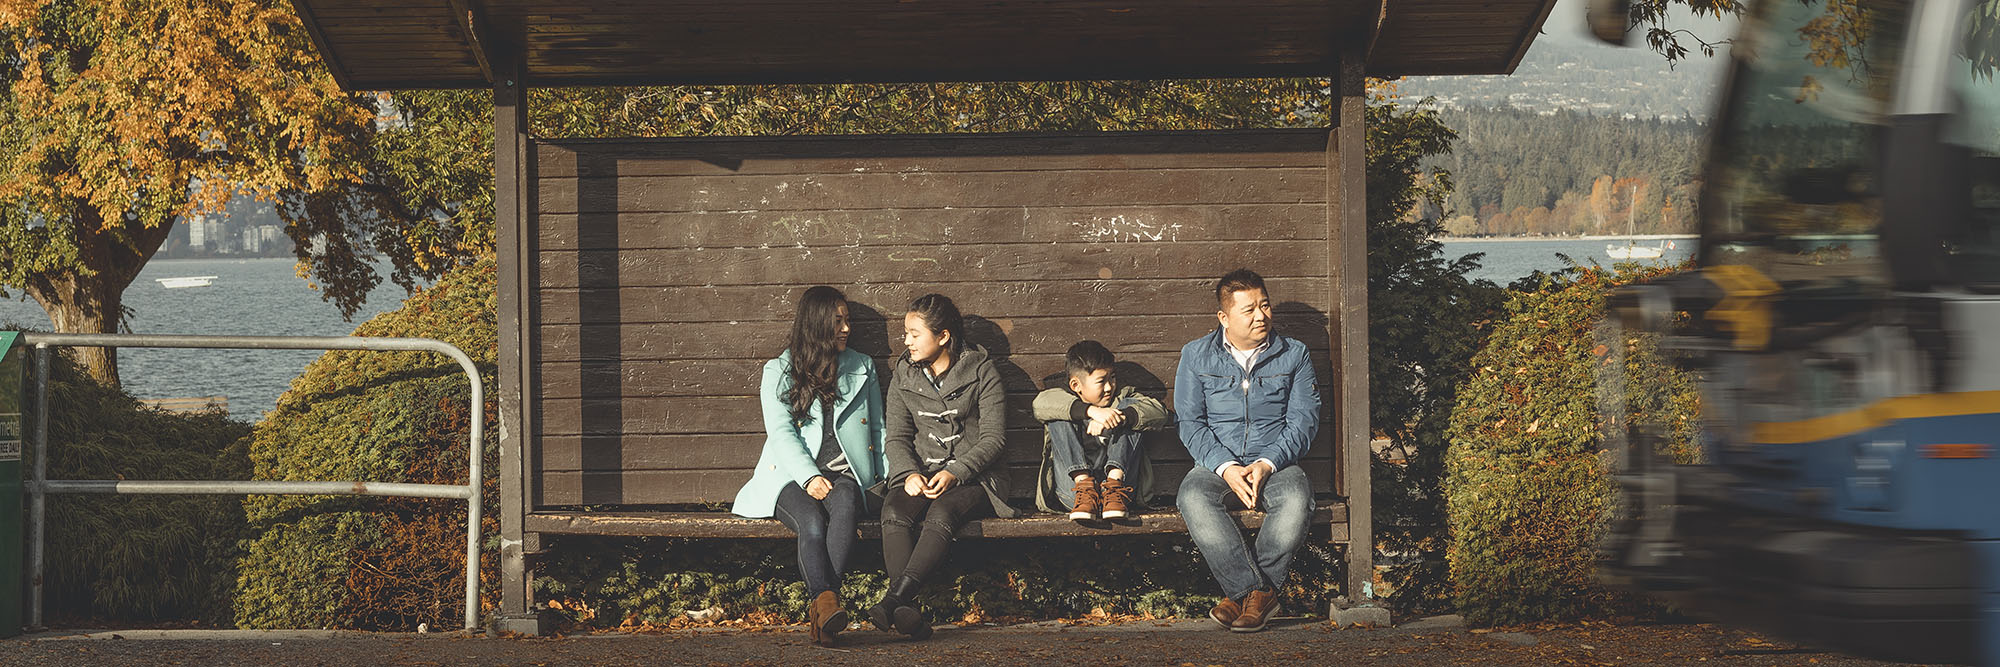
5 | You’re choosing transit on weekends
During fall 2021, systemwide ridership continued to return slightly more on weekends than on weekdays. Recovery was 62 per cent on weekends compared to 58 per cent on weekdays.
This is likely related to people returning to transit for recreation or errands, while still travelling less for work during the week.
For example, in September during North Vancouver’s Shipyards Festival, SeaBus ridership was 86 per cent of what was in 2019 for the same event.
Although recovery is higher on weekends, average weekday boardings still exceeded average weekend/holiday boardings in fall 2021.
![]()
Thank you for choosing transit for your everyday needs. You’ve helped make Metro Vancouver’s transit system one the fastest in ridership recovery compared to large transit agencies in Canada and the U.S.
To learn more about these ridership trends and more from 2021, check out the 2021 Transit Service Performance Review and the 2021 HandyDART Performance Review.
Very informative content
Nice content, please checkout my website Pourit.in