
Ridership is on the rise: Q1 2017 reports continued growth
Ridership is on the rise: Q1 2017 reports continued growth
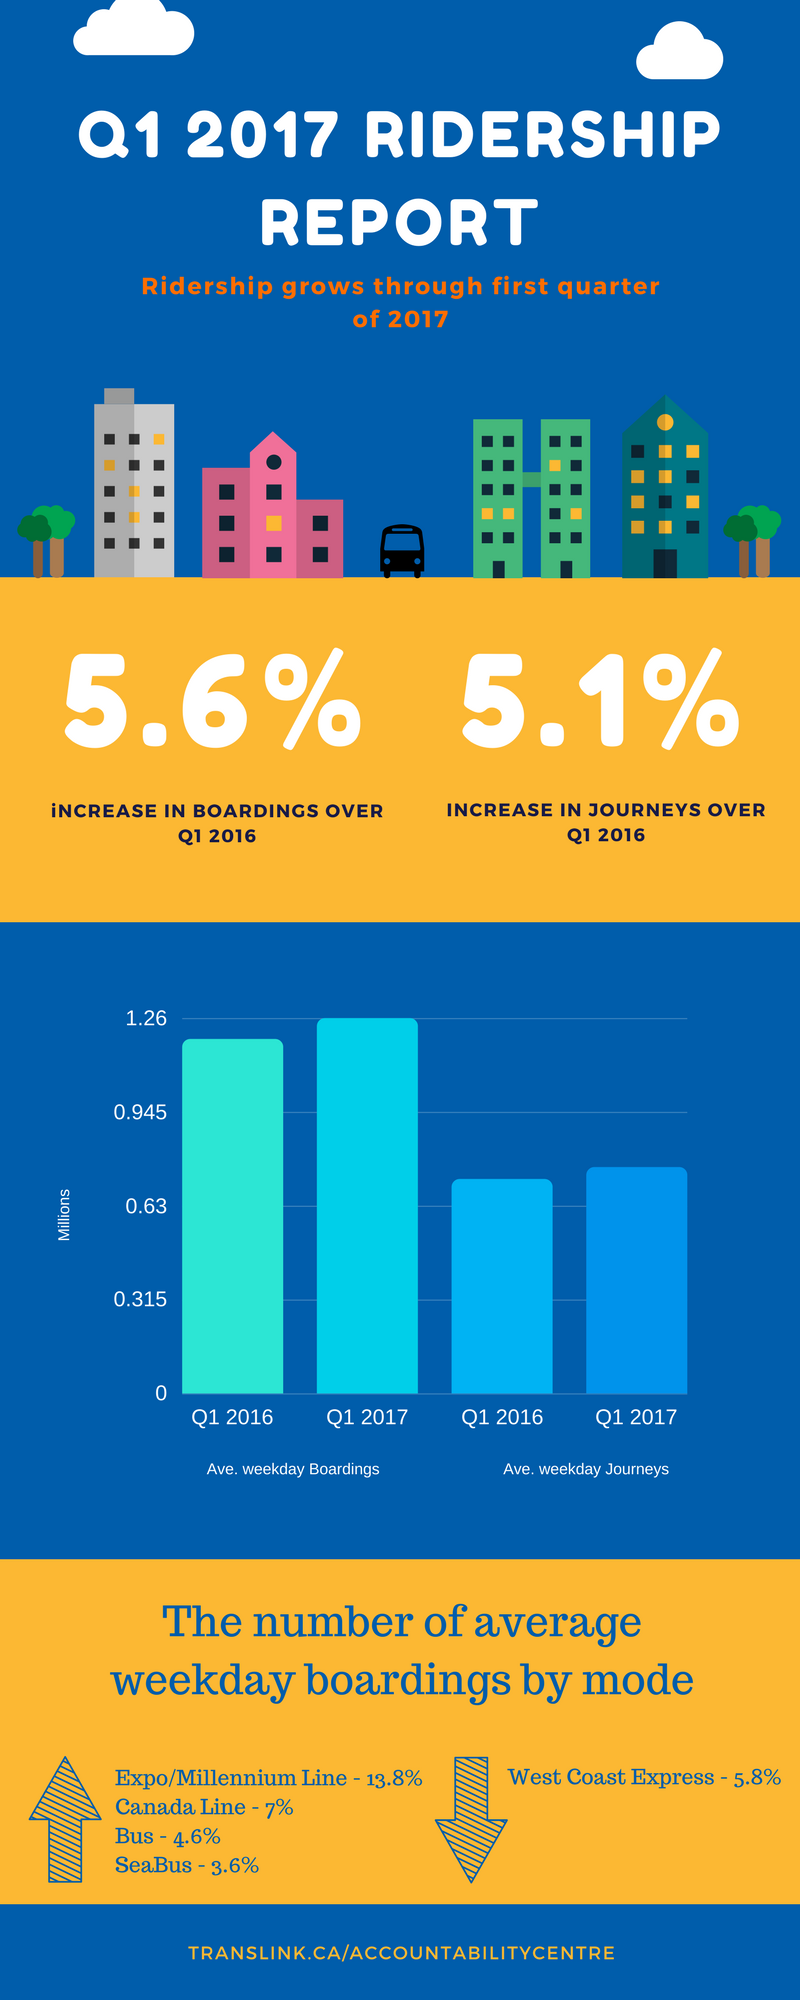
The annual trend of breaking ridership records continues through the first quarter of 2017. A 5.6% increase in individual Boardings, and a 5.1% increase in Journeys (number of start-to-finish trips taken on transit) shows transit ridership growing significantly compared to the same period last year.
Contributing to the growth is an increase in the number of average weekday Boardings for all modes with the exception of West Coast Express which saw a slight decrease.
- Expo/Millennium Line – up 13.8%
- Canada Line – up 7%
- Bus – up 4.6%
- SeaBus – up 3.6%
- West Coast Express – down 5.8%
Explanation of growth
Various key factors play a role in ridership growth. We have identified some of the biggest players:
Transit Service Hours – Overall increased service hours in 2017 including the implementation of the Evergreen Extension.
Number of working days – There were 2 more working days in Q1 of 2017 over the previous year.
Weather – Metro Vancouver saw unseasonably cold and snowy conditions this winter. While the impact of weather on transit is not clear, data shows that commuters often substitute modes from walking/cycling to transit/driving during inclement weather.
Fuel Prices – Fuel prices in Q1 of 2017 averaged 15% higher than during the same time last year, and is a likely cause for commuters to park their vehicles and hop on transit.
Transit Fare Prices – With no change in transit fares over the past year, transit remains an attractive option.
Economic Growth & Activities – Various economic factors have contributed to growing ridership such as highest new housing starts, increased tourism, increased retail sales, and increased population and employment.
For more information check out our Accountability Centre.
Author: Sarah Kertcher