Record numbers for the first half of 2017 puts TransLink on track for a record-breaking year!
Record numbers for the first half of 2017 puts TransLink on track for a record-breaking year!


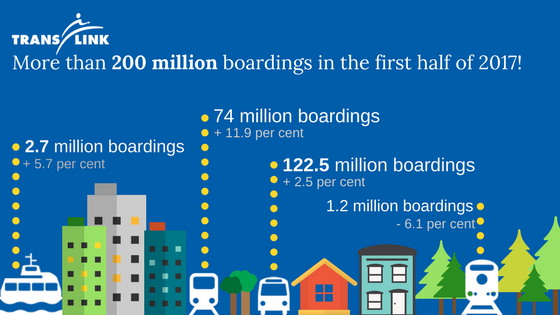
With over 200 million boardings across the region for the first half of 2017 and more than 1.26 million average weekday boardings in the first three months of this year, it’s no surprise that TransLink is on track for record-breaking ridership!
We saw a 5.7 per cent increase this half of the year compared to the same period last year!
Ridership numbers from January 1 to June 30, 2017
- SkyTrain: 74 million boardings (+ 11.9 per cent compared to same period in 2016)
- Bus: 122.5 million boardings (+ 2.5 per cent compared to same period in 2016)
- SeaBus: 2.7 million boardings (+ 5.7 per cent compared to same period in 2016)
- West Coast Express: 1.2 million boardings (- 6.1 per cent compared to same period in 2016)
“This increase in ridership is great news, and builds on the growth we saw in 2016. It’s great to see people taking advantage of new service we started putting on the road in January,” said TransLink CEO Kevin Desmond. “I’m thrilled we’re in a position to continue adding even more transit service in coming months, including in September one of our largest single increases to bus service since the run-up to the 2010 Olympic Winter Games.”
10-Year Vision
The addition of new transit service in 2017 as part of delivering on the 10-Year Vision is one of the driving attributes in this year’s boost in ridership. Since the beginning of 2017, we have added 89,000 bus service hours, focusing on the region’s most congested areas. Fall service changes coming this September will include the addition of new bus routes and will be the largest expansion since 2010 when we hosted the Olympic Winter Games! The Transit Service Performance Review is one of the tools that we use to direct change.
Transit Service Performance Review (TSPR)
Today, we released the findings of the 2016 Transit Service Performance Review (TSPR), a comprehensive review of ridership and service productivity for bus, SeaBus, SkyTrain and West Coast Express.
Have a read of the full 2016 Transit Service Performance Review yourself!
The data collected from the TSPR gives us valuable insights on boardings, ridership, transit trends and more. This data helps us identify opportunities to reduce overcrowding, improve performance and reliability and meet the needs of our customers as the region continues to grow.
Did you know? We gather data from multiple sources such as fare gates at SkyTrain stations and SeaBus terminals, automated passenger counter units on buses and Compass Card validators.
Increasing Ridership
We had record ridership in 2016, with 384.8 million boardings. This represents a 4.5 per cent increase over the previous year!
Ridership growth in 2016 was the largest since 2010, when the region hosted the Olympic Winter Games. This growth was likely due to strong economic activity, an increase in transit service hours and the launch of Compass Card.
The annual review shows that ridership across the system continues to grow:
- Bus ridership continued to increase throughout the day, particularly during evenings and on Saturdays
- Bus boardings increased 4.6 per cent to 239.6 million
- All three SkyTrain lines experienced ridership growth. Canada Line boardings grew by 5.5 per cent, while boardings on the Expo and Millennium Lines grew by 4.1 per cent
- Evergreen Extension stations saw steady ridership over their first four weeks of service, despite record snowfall
Did you know? System-wide ridership is measured in boardings and journeys. A boarding is considered each time a passenger enters a fare paid zone using Compass fare media or any other proof of payment. A journey is a complete transit trip using Compass fare media or any other proof of payment, regardless of the number of transfers.
Other trends identified during the 2016 Transit Service Performance Review include:
- South of Fraser led all Metro Vancouver sub-regions in ridership growth – seeing a 10 per cent increase over the previous year. Much of this growth can be attributed to increased ridership of the 96 B-Line
- With its 4.3 million annual boardings, up 15 per cent over 2015, the 96 B-Line had the largest increase in annual boardings of any route in the system
- SeaBus boardings declined by 2.8 per cent in 2016, due to lower summer ridership. However, if SeaBus were a bus route, it would still rank as having the 11th highest boardings in all of Metro Vancouver
Want to learn more and keep up with how we’re meeting our goals? Check out the Accountability Centre.
Author: Christina Jakopin


I just tapped the fare gate at waterfront and went through and before the gate closed some guy went through as well (aka not paying). I guess he won’t get counted in the record ridership numbers.
Hi Jim, unfortunately fare evasion is difficult to eliminate entirely, and while the Compass fare gates have done an excellent job at deterring if people want they will find a way to sneak in. We do have Transit Police and Transit Security on the system regularly and anyone caught without a valid fare is subject to a $173 fine.