
10 most-used SkyTrain stations and bus routes, and more!
10 most-used SkyTrain stations and bus routes, and more!

Today, we released the findings of the 2017 Transit Network Performance Review (TSPR), which is like a report card on transit service!
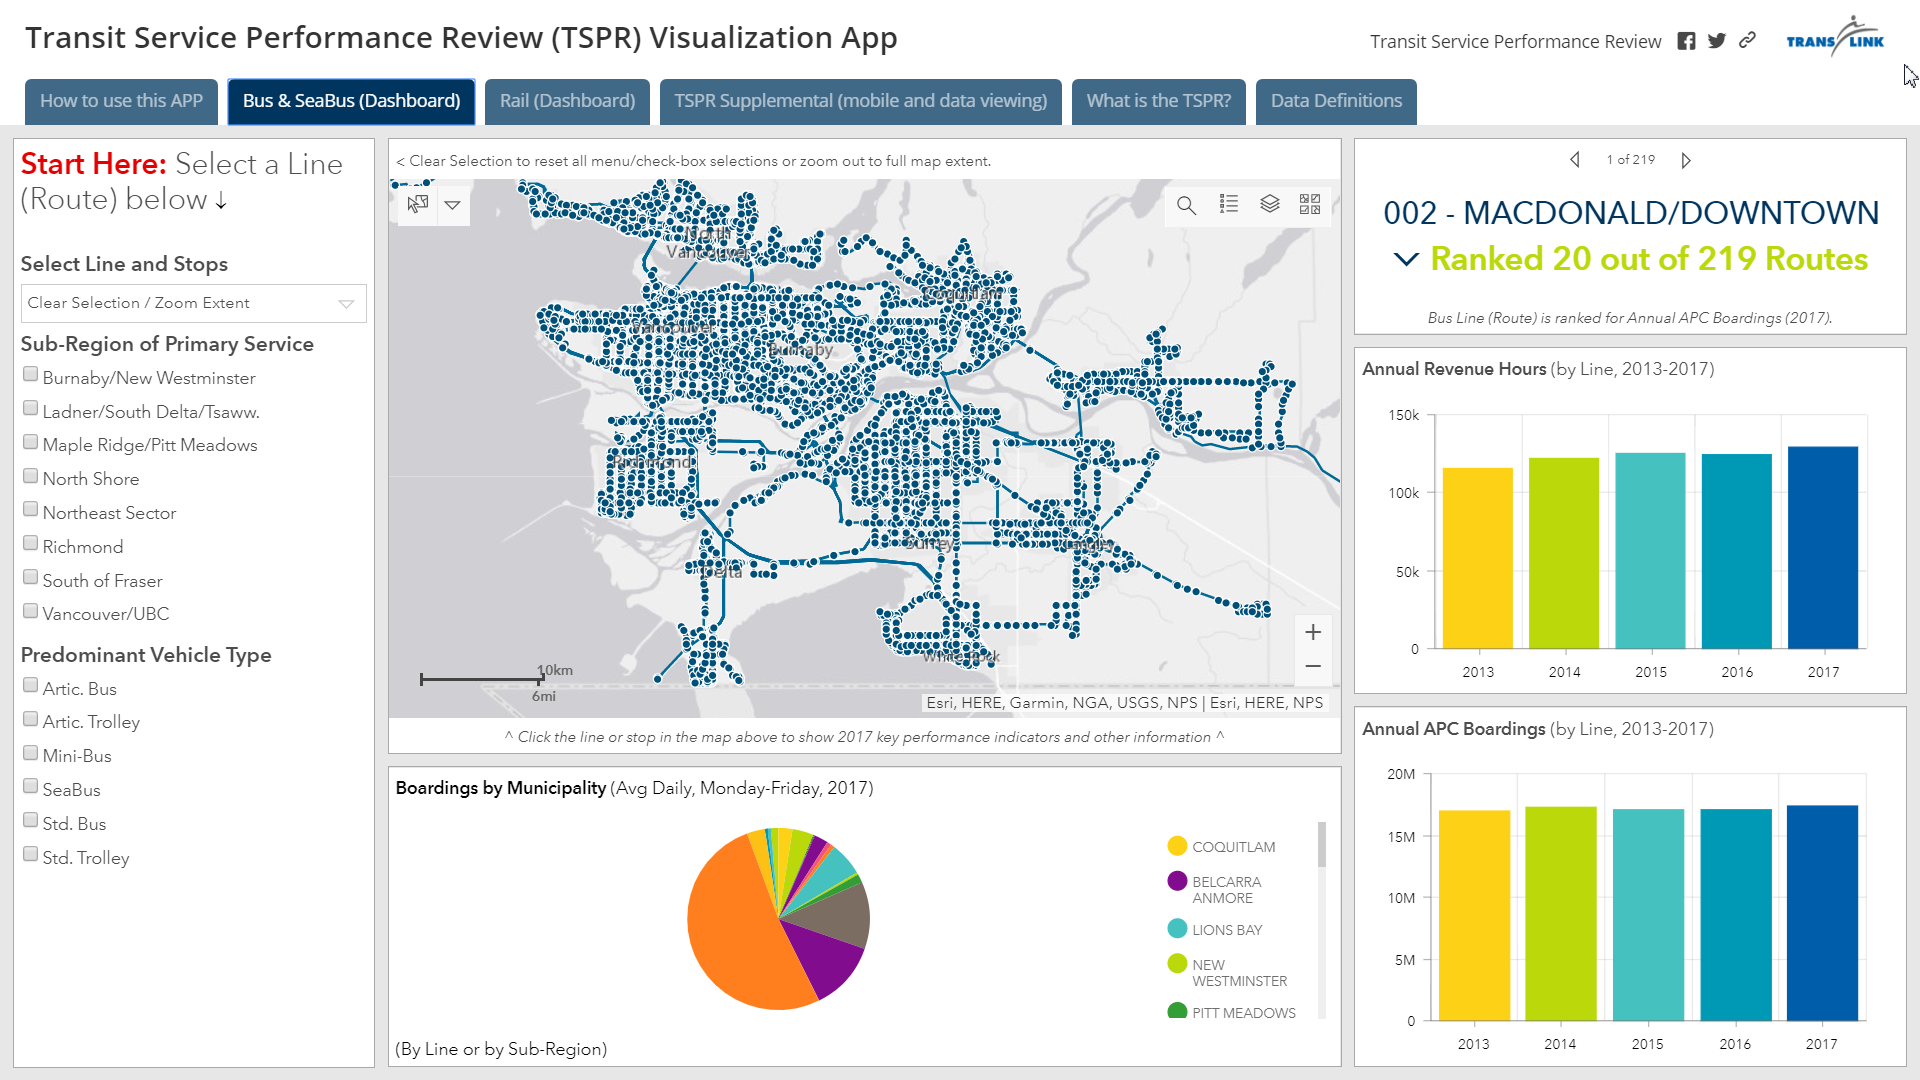
New this year is an interactive TSPR dashboard and mapping tool! Make sure you check it out. It provides new types of data and allows users to explore it in a more intuitive way. The dashboard includes all of the route-level data reported in the previous TSPRs, and the mapping tool includes data down to individual bus stops.
Needless to say, there’s a wealth of information in the TSPR. That’s why we wanted to pull out some interesting lists for you!
10 most-used SkyTrain stations
Average weekday boardings
- 1. Waterfront (Canada and Expo Lines): 37,500*
- 2. Commercial–Broadway (Expo and Millennium Lines): 24,900
- 3. Burrard (Expo Line): 23,000
- 4. Granville (Expo Line): 20,600
- 5. Metrotown (Expo Line): 19,900
- 6. Vancouver City Centre (Canada Line): 18,400
- 7. Stadium–Chinatown (Expo Line): 16,200
- 8. New Westminster (Expo Line): 14,800
- 9. Broadway–City Hall (Canada Line): 14,500
- 10. Main Street–Science World (Expo Line): 14,300
*This is the first year the Canada Line has been incorporated with Expo Line.
10 most-used bus and SeaBus routes
Annual automatic passenger counter (APC) boardings
- 1. 99 UBC/Commercial–Broadway Station: 17,421,000
- 2. 41 UBC/Joyce–Collingwood Station: 8,918,000
- 3. 20 Downtown/Victoria: 8,630,000
- 4. 49 UBC/Metrotown Station: 8,034,000
- 5. 25 UBC/Brentwood Town Centre Station: 7,642,000
- 6. 16 Arbutus/29th Avenue Station: Vancouver/UBC 7,549,000
- 7. 9 UBC/Alma/Granville/Commercial–Broadway Station/Boundary: 7,273,000
- 8. 3 Downtown/Main: 6,724,000
- 9. SeaBus: 6,343,000
- 10. 106 Edmonds Station/New Westminster Station: 6,212,000
10 most-crowded bus routes
Annual revenue hours with overcrowding (percentage of ARHs with overcrowding)
- 1. 99 UBC/Commercial-Broadway Station B-Line: 39,500 (31%)
- 2. 25 Brentwood Station/UBC: 17,800 (19%)
- 3. 41 Joyce Station/Crown/UBC: 17,200 (17%)
- 4. 49 Metrotown Station/Dunbar/UBC: 15,800 (18%)
- 5. 95 Burrard Station/SFU B-Line: 11,900 (14%)
- 6. 100 22nd Street Station/Marpole Loop: 9,900 (18%)
- 7. 319 Scott Road Station/Newton Exchange: 9,400 (16%)
- 8. 410 22nd Street Station/Queensborough/Railway: 8,900 (8%)
- 9. 250 Horseshoe Bay/Dundarave/Vancouver: 8,500 (14%)
- 10. 16 29th Avenue Station/Arbutus: 8,400 (8%)
10 bus and SeaBus routes with the most growth
Increase in annual automated passenger counter (APC) boardings
- 1. 96 B-Line Guildford Exchange/Newton Exchange: 757,000
- 2. 49 UBC/Metrotown Station: 643,000
- 3. 319 Scott Road Station/Newton Exchange: 543,000
- 4. 3 Downtown/Main: 528,000
- 5. 100 Marpole Loop/22nd Street Station: 497,000
- 6. 10 Downtown/Granville: 478,000
- 7. 410 22nd Street Station/Railway: 429,000
- 8. SeaBus: 414,000
- 9. 16 Arbutus/29th Avenue Station: 409,000
- 10. 99 B-Line UBC/Commercial–Broadway Station: 389,000
Now, you’re probably thinking, “Wow, our transit system is really busy!” It sure is.
Investments in Phase One of the 10-Year Vision helped propel ridership to record heights. Not only was it a record year for Metro Vancouver transit in 2017 with 407 million boardings across the system, ridership last month smashed records. System-wide, ridership was up 9 per cent in May over the same month last year.
More improvements are already on the way as part of Phase One.
The 25, 100 and 319 routes, which are among the top 10 most-crowded routes in 2017, are receiving service increases to reduce overcrowding.
Eighty new SkyTrain cars will start arriving early next year. These new cars will increase capacity by about 10 per cent for Expo Line, 23 per cent for Millennium Line and 30 per cent for Canada Line. That equates to a total of 8,200 additional spaces per peak hour on both directions on all three SkyTrain lines!
If approved, the Phase Two Investment Plan will unlock even more new funding. Customers will see new Phase Two Plan transit services as early as 2019.
Want to learn more? You can read the full 2017 Transit Network Performance Review.
Hey, I don’t see the 96 on there. Yet it is getting rail replacement. And not even a good one for the money.
96 is listed as the top bus for the routes with the most growth. Guess the idea is to curb it before it goes out of hand?
Hi Michael, it’s not in the top 10 most-used bus routes, but you can see it’s the fastest growing one. By 2041, the South of Fraser sub-region is expected to grow by more than 300,000 new residents and 200,000 new jobs. This is going to create new demand on our transportation network. The Surrey–Newton–Guildford LRT about helping to shift people away from single-occupancy vehicles onto transit today and absorbing that new demand in the future.
^For the busiest bus routes
I looked at the Expo Line under Skytrain Station Summaries and it says Patterson, Royal Oak and Edmonds stations opened in 2002 (vs 1985 when the rest of the initial line opened). How many other ‘oops’ are there???
Notice that 5 of the top 10 routes go to UBC. If we built a subway/skytrain all the way to UBC, a lot of this bus ridership would be diverted to the UBC/Broadway line at a much lower operating cost than buses.