


How TransLink is fighting back against bus delays
How TransLink is fighting back against bus delays
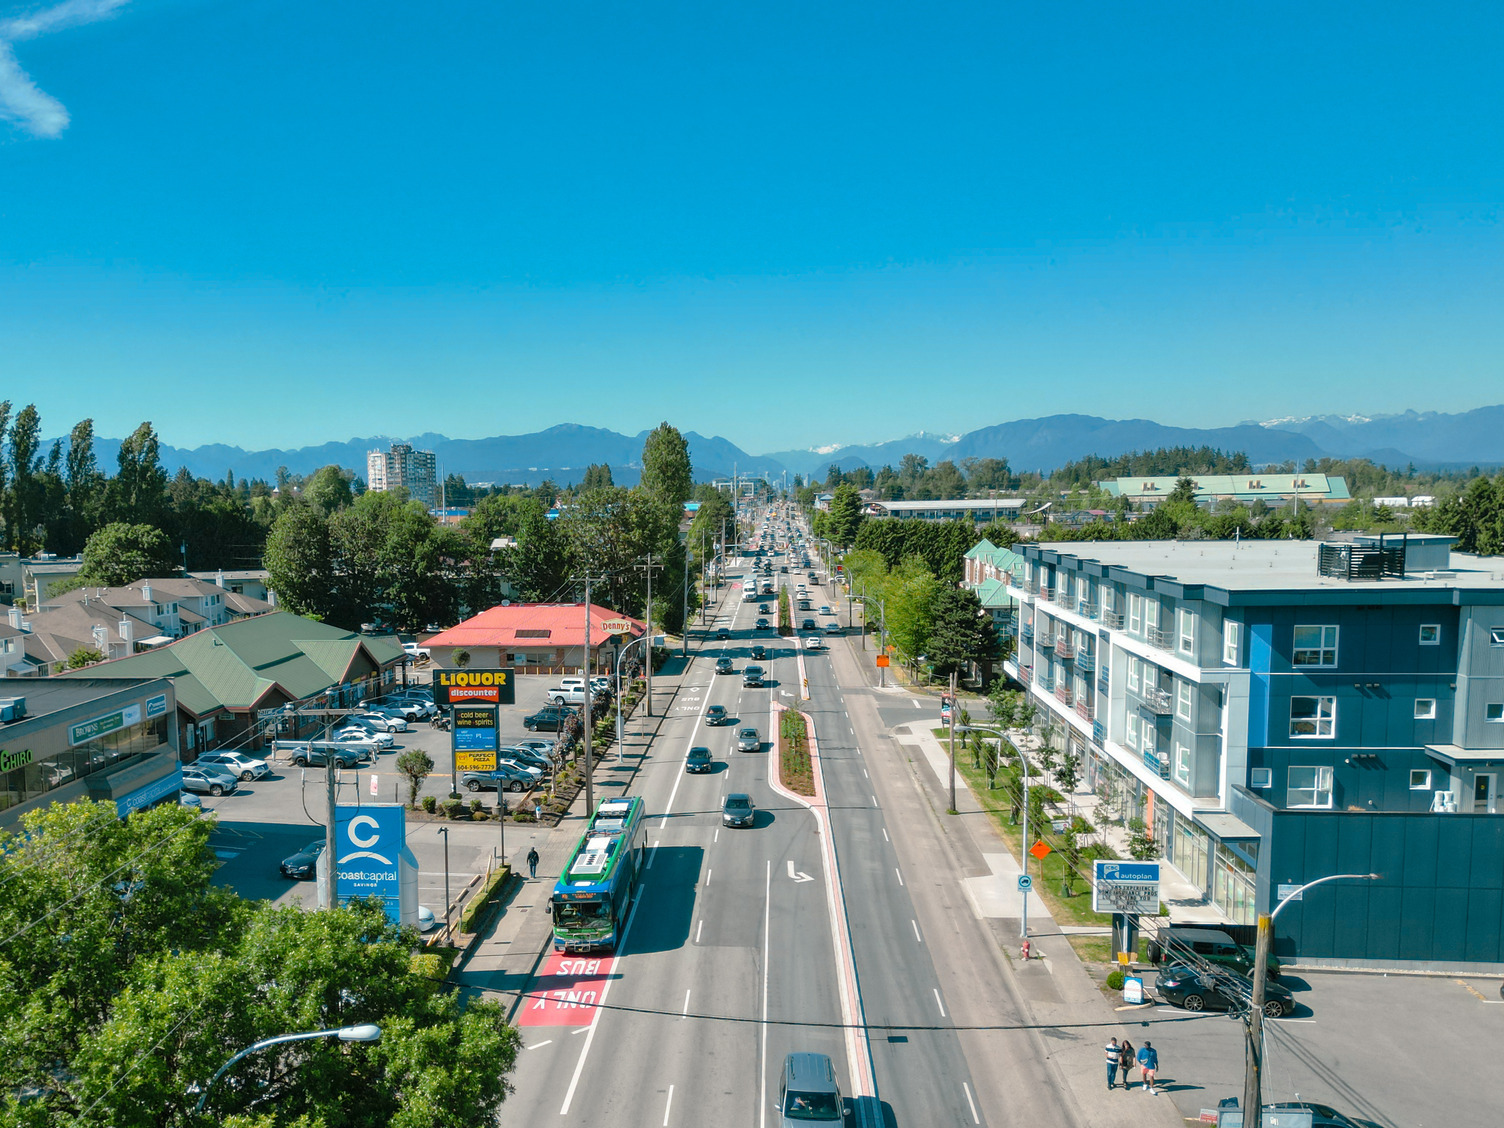
If you’ve ever felt like time stands still as your bus sits idle at a red light or a congested intersection, you’re not imagining things.
Bus delays are real, widespread, and cost Metro Vancouver riders more than 44,000 hours of lost time every weekday. But we’re fighting back, and the positive results are showing up on routes across the region.
TransLink’s newly released 2025 Bus Speed and Reliability (BSR) Report provides an updated look at bus delays across Metro Vancouver.
Here are the highlights:
Bus delays are costly
Bus delays account for about 13 per cent of bus operating costs in Metro Vancouver — roughly $115 million every year that could otherwise be invested into better, more reliable service.
While delays are felt across Metro Vancouver, they aren’t shared equally. The Vancouver/UBC sub-region still carries the heaviest load, accounting for nearly 40 per cent of all person-hours of delay. However, the pressure is shifting. The Southeast sub-region, including Surrey and Langley, has seen its share of delay grow from 18 to 28 per cent between 2018 and 2024. As the region grows, so does the need to act.
Delivering faster, more reliable bus service
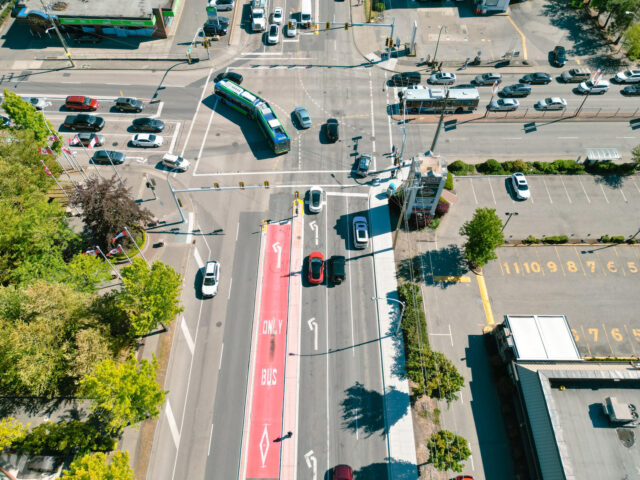
Since 2018, TransLink has added nearly 80 lane-kilometres of new bus priority measures to the network, including 60 lane-kilometres of all-day, bus-only lanes. Coverage of the Frequent Transit Network (FTN) has nearly doubled, climbing from nine to 17 per cent. The FTN is the network of traffic corridors where transit runs at least every 15 minutes all day into the evening in both directions, seven days a week.
These projects serve nearly 100 routes that carried more than half of TransLink’s ridership in fall 2024, making service faster and more reliable for nearly 190,000 passenger trips on an average weekday.
The 2025 BSR report reviews 27 newly completed projects, bringing the total to 62 that have been evaluated since the program launched in 2018. These bus priority projects have typically reduced travel times by five to 35 per cent, with payback periods in under 10 years.
Guiding future projects
- Big investments along the same corridor deliver the most noticeable results for riders. When improvements are made along an entire corridor rather than at isolated spots, the impact is clearer and more meaningful. The R6 RapidBus is the strongest recent example: cutting travel times by about 20 per cent at peak times — more than 10 minutes compared to the previous #319 service.
- Smaller fixes matter too. Targeted hotspot improvements help keep costs in check by reducing the need to add more buses to compensate for growing congestion. Bus priority projects work best together. For example, a combined bus lane and signal priority project at East 3rd Street and Kennard Avenue on the North Shore reduced travel times by more than 10 per cent at peak times on weekdays. Curbside bus lanes also work best where they are least affected by turning traffic. For example, in Surrey, a Business Access and Transit (BAT) lane on 152nd Street (where there are few entries) reduced weekday travel times by 20 per cent all day.
- Some of the most cost-effective wins have come from routing adjustments. This is a newer approach that lets buses bypass bottlenecks entirely. A new bus-only connection on Bridgeport Road in Richmond, funded by the Ministry of Transportation and Transit, shortened routes and gave buses a queue jump at a congested Highway 99 on-ramp, cutting travel times by more than 40 seconds (25 per cent) per trip all day. At Coquitlam Central Station, a new midblock signal lets buses skip two signals and a lengthy exit route, saving riders nearly 50 seconds (20 per cent) per trip all day.
- Projects on retail streets require early collaboration with businesses and communities. On busy retail streets, parking, deliveries, and local access all compete for the same space. Work underway on Granville Street in Vancouver is showing how partnerships can deliver real improvements for riders without leaving businesses behind.
Looking Ahead
The 2025 BSR Report is not just a lookback; it’s also a roadmap forward. The lessons we’re learning are already shaping these projects. The biggest gains for riders come from investing along entire corridors, and that’s the approach guiding our major work now underway or nearing completion on Granville, Kingsway, Hastings, 49th and West 4th avenues — with more improvements coming through 2026 and 2027.
The Bus Priority Vision, which was supported by the Mayors’ Council in 2024, continues to guide this work over the next decade, with the goal of expanding bus priority across the entire FTN. In short, these investments create savings that can be put back into the system, supporting more frequent, reliable service for riders across the region.
Want to dig into the full findings? Read the 2025 BSR Report here.





If 50 seconds represents 20% of trip time, are most riders only on the bus for 4 minutes?